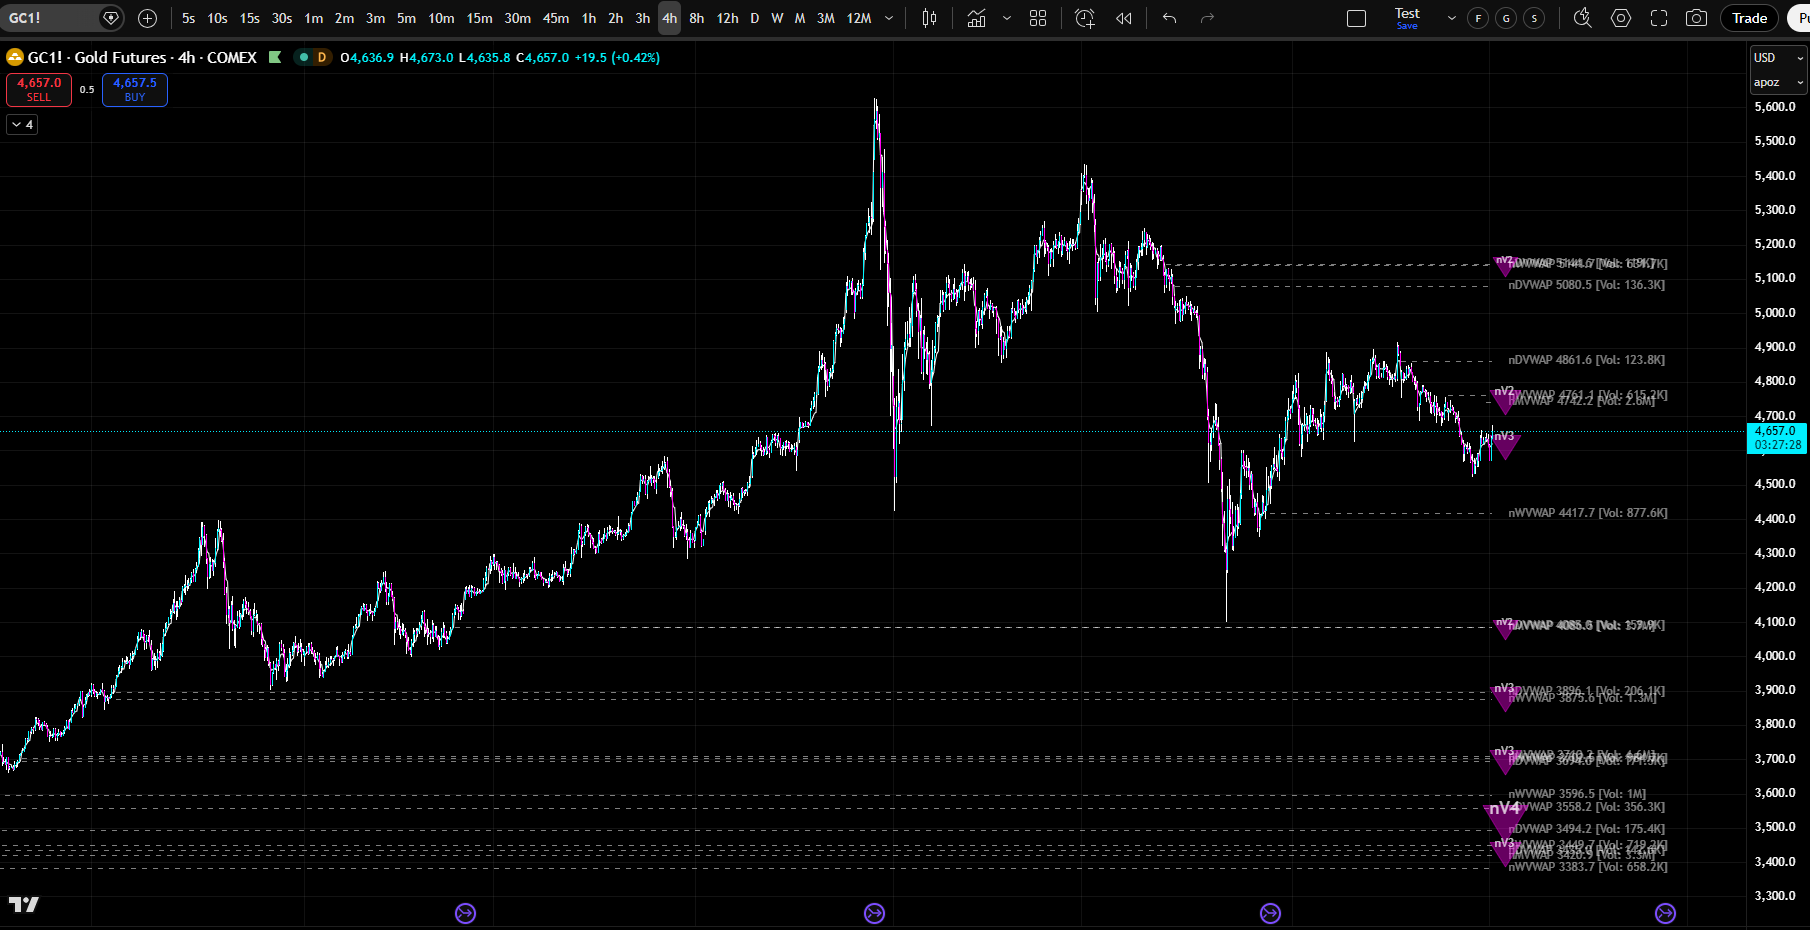
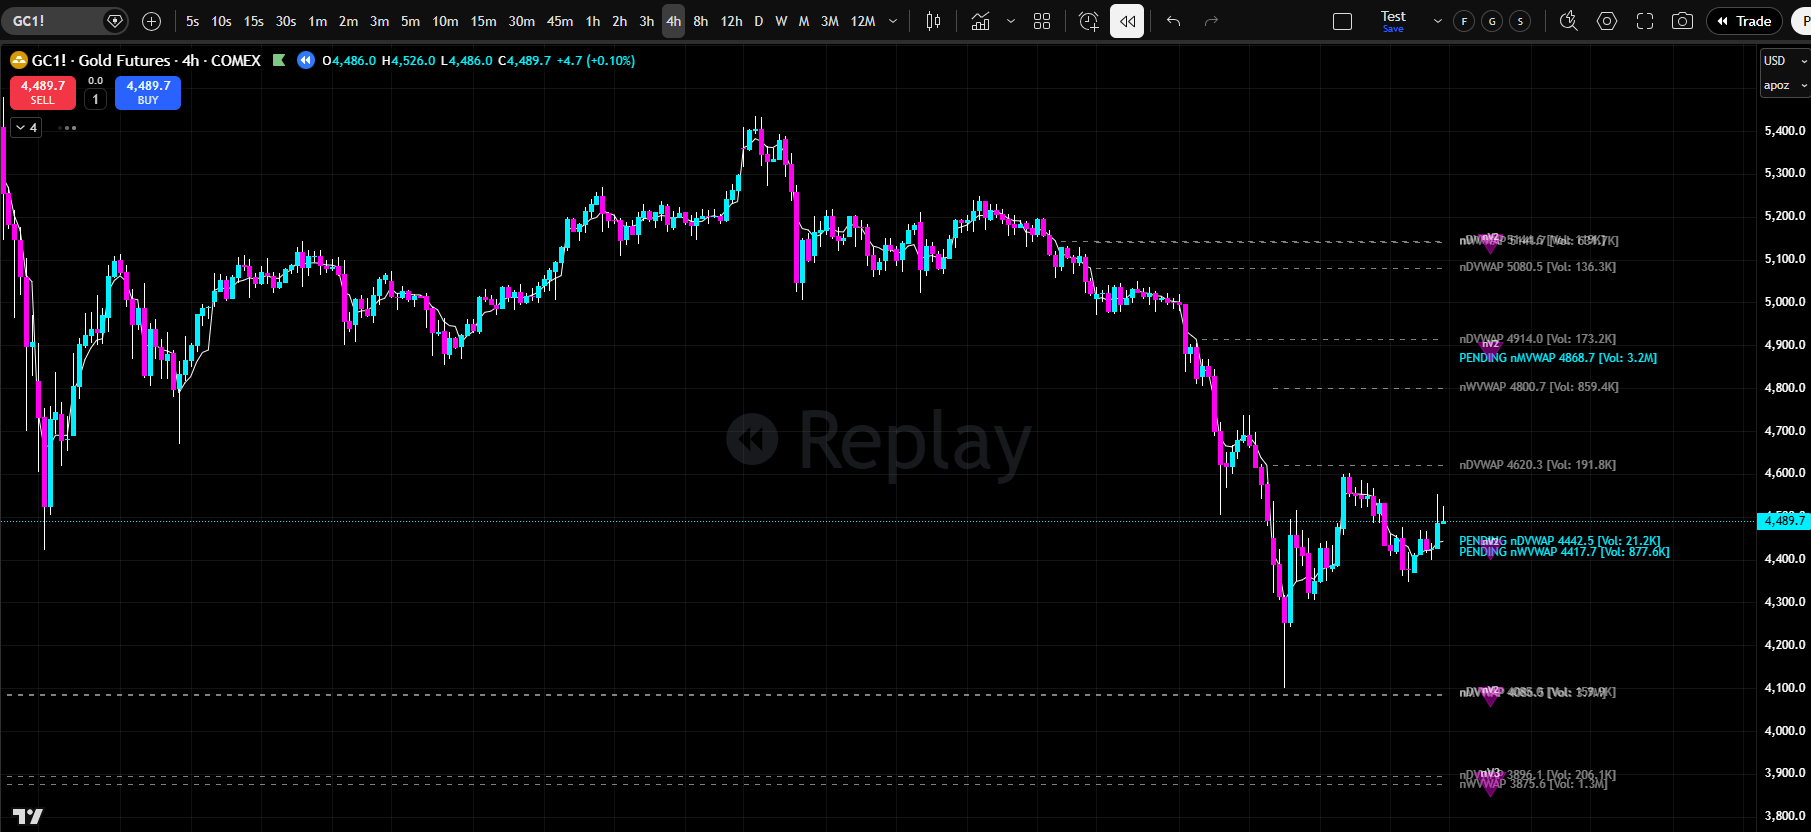
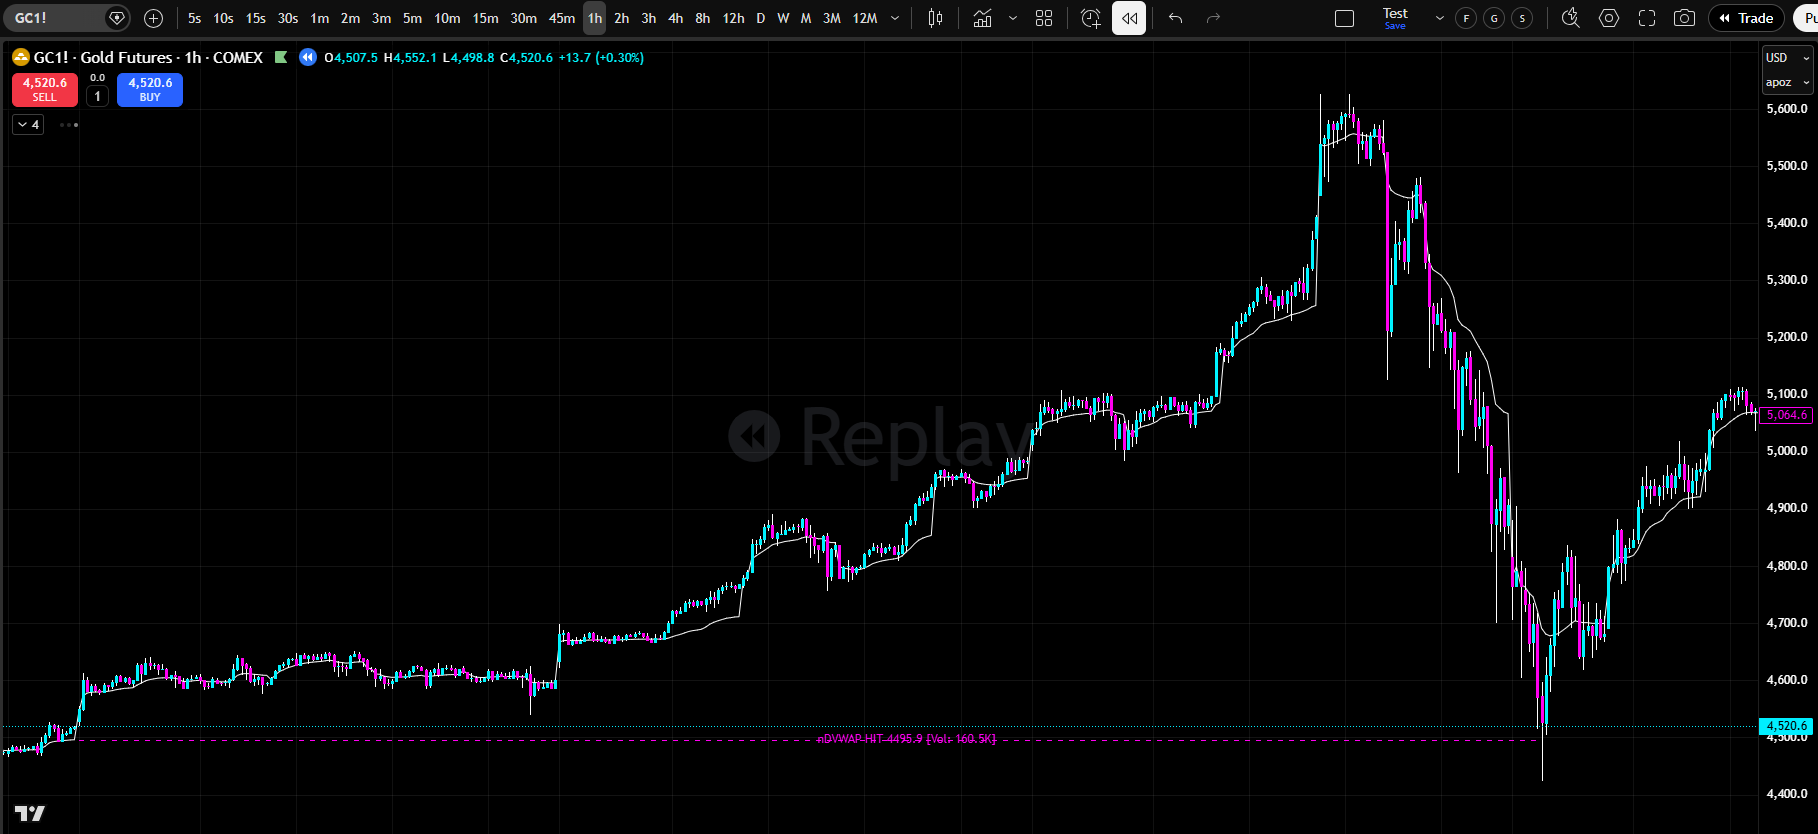
ABOUT "NAKED" VWAP
MULTI-TIMEFRAME STRUCTURAL CONFLUENCE
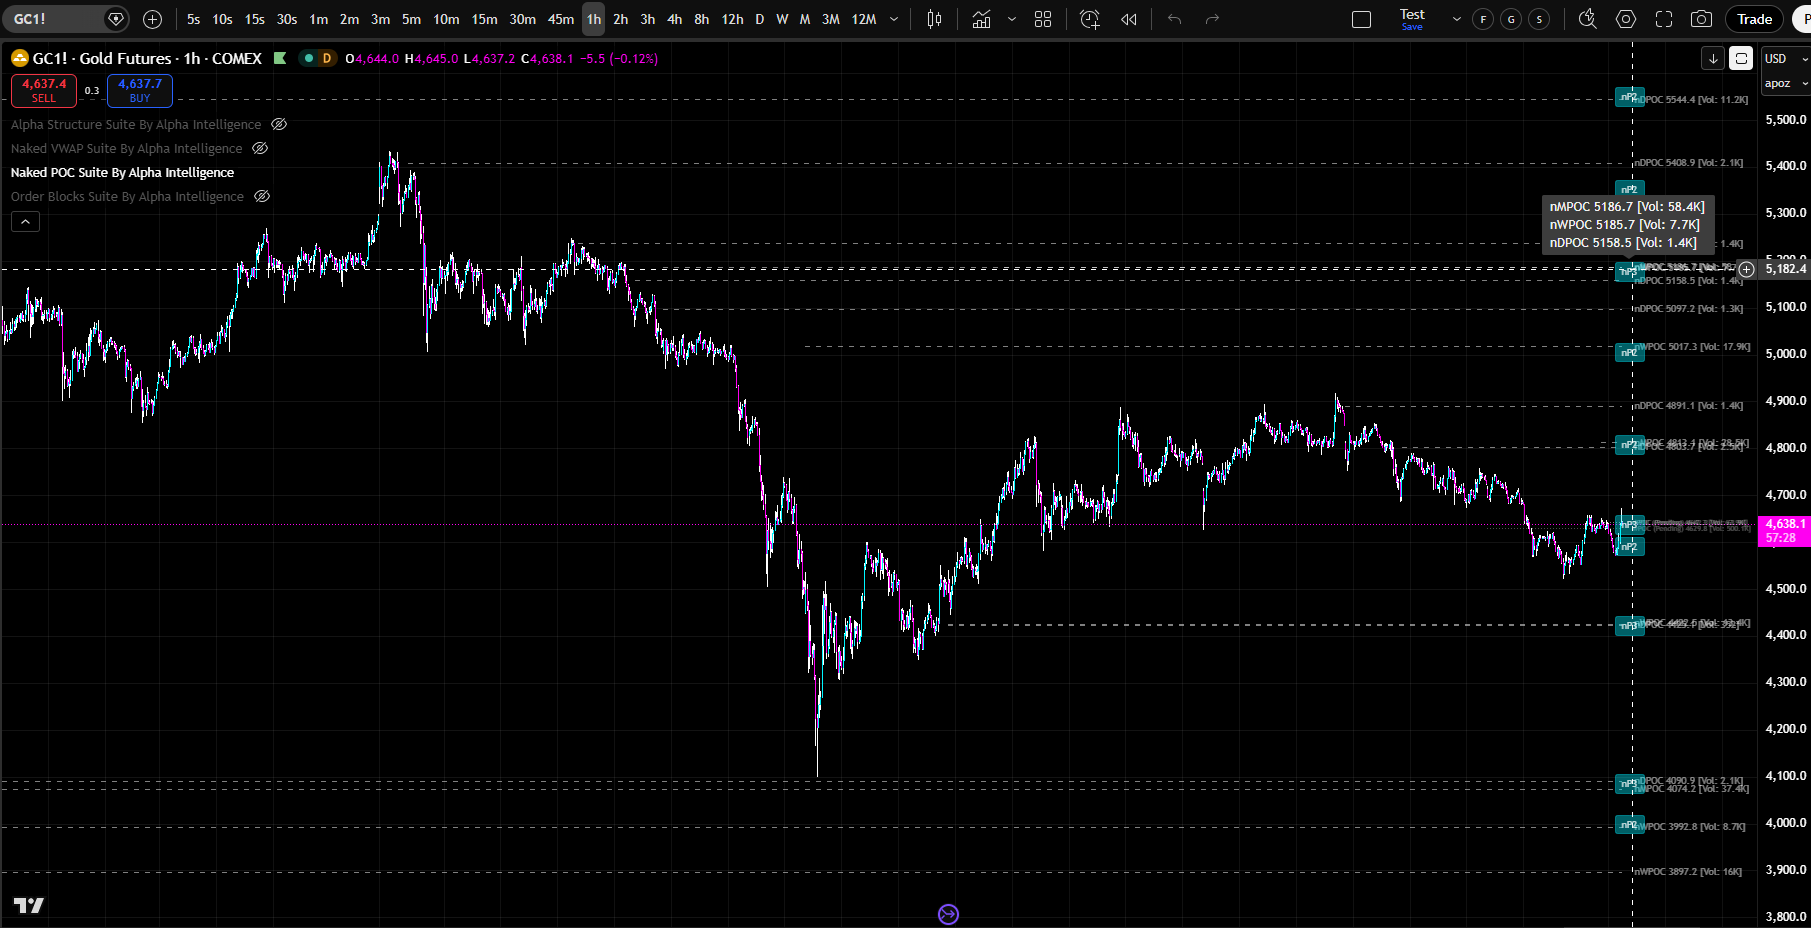
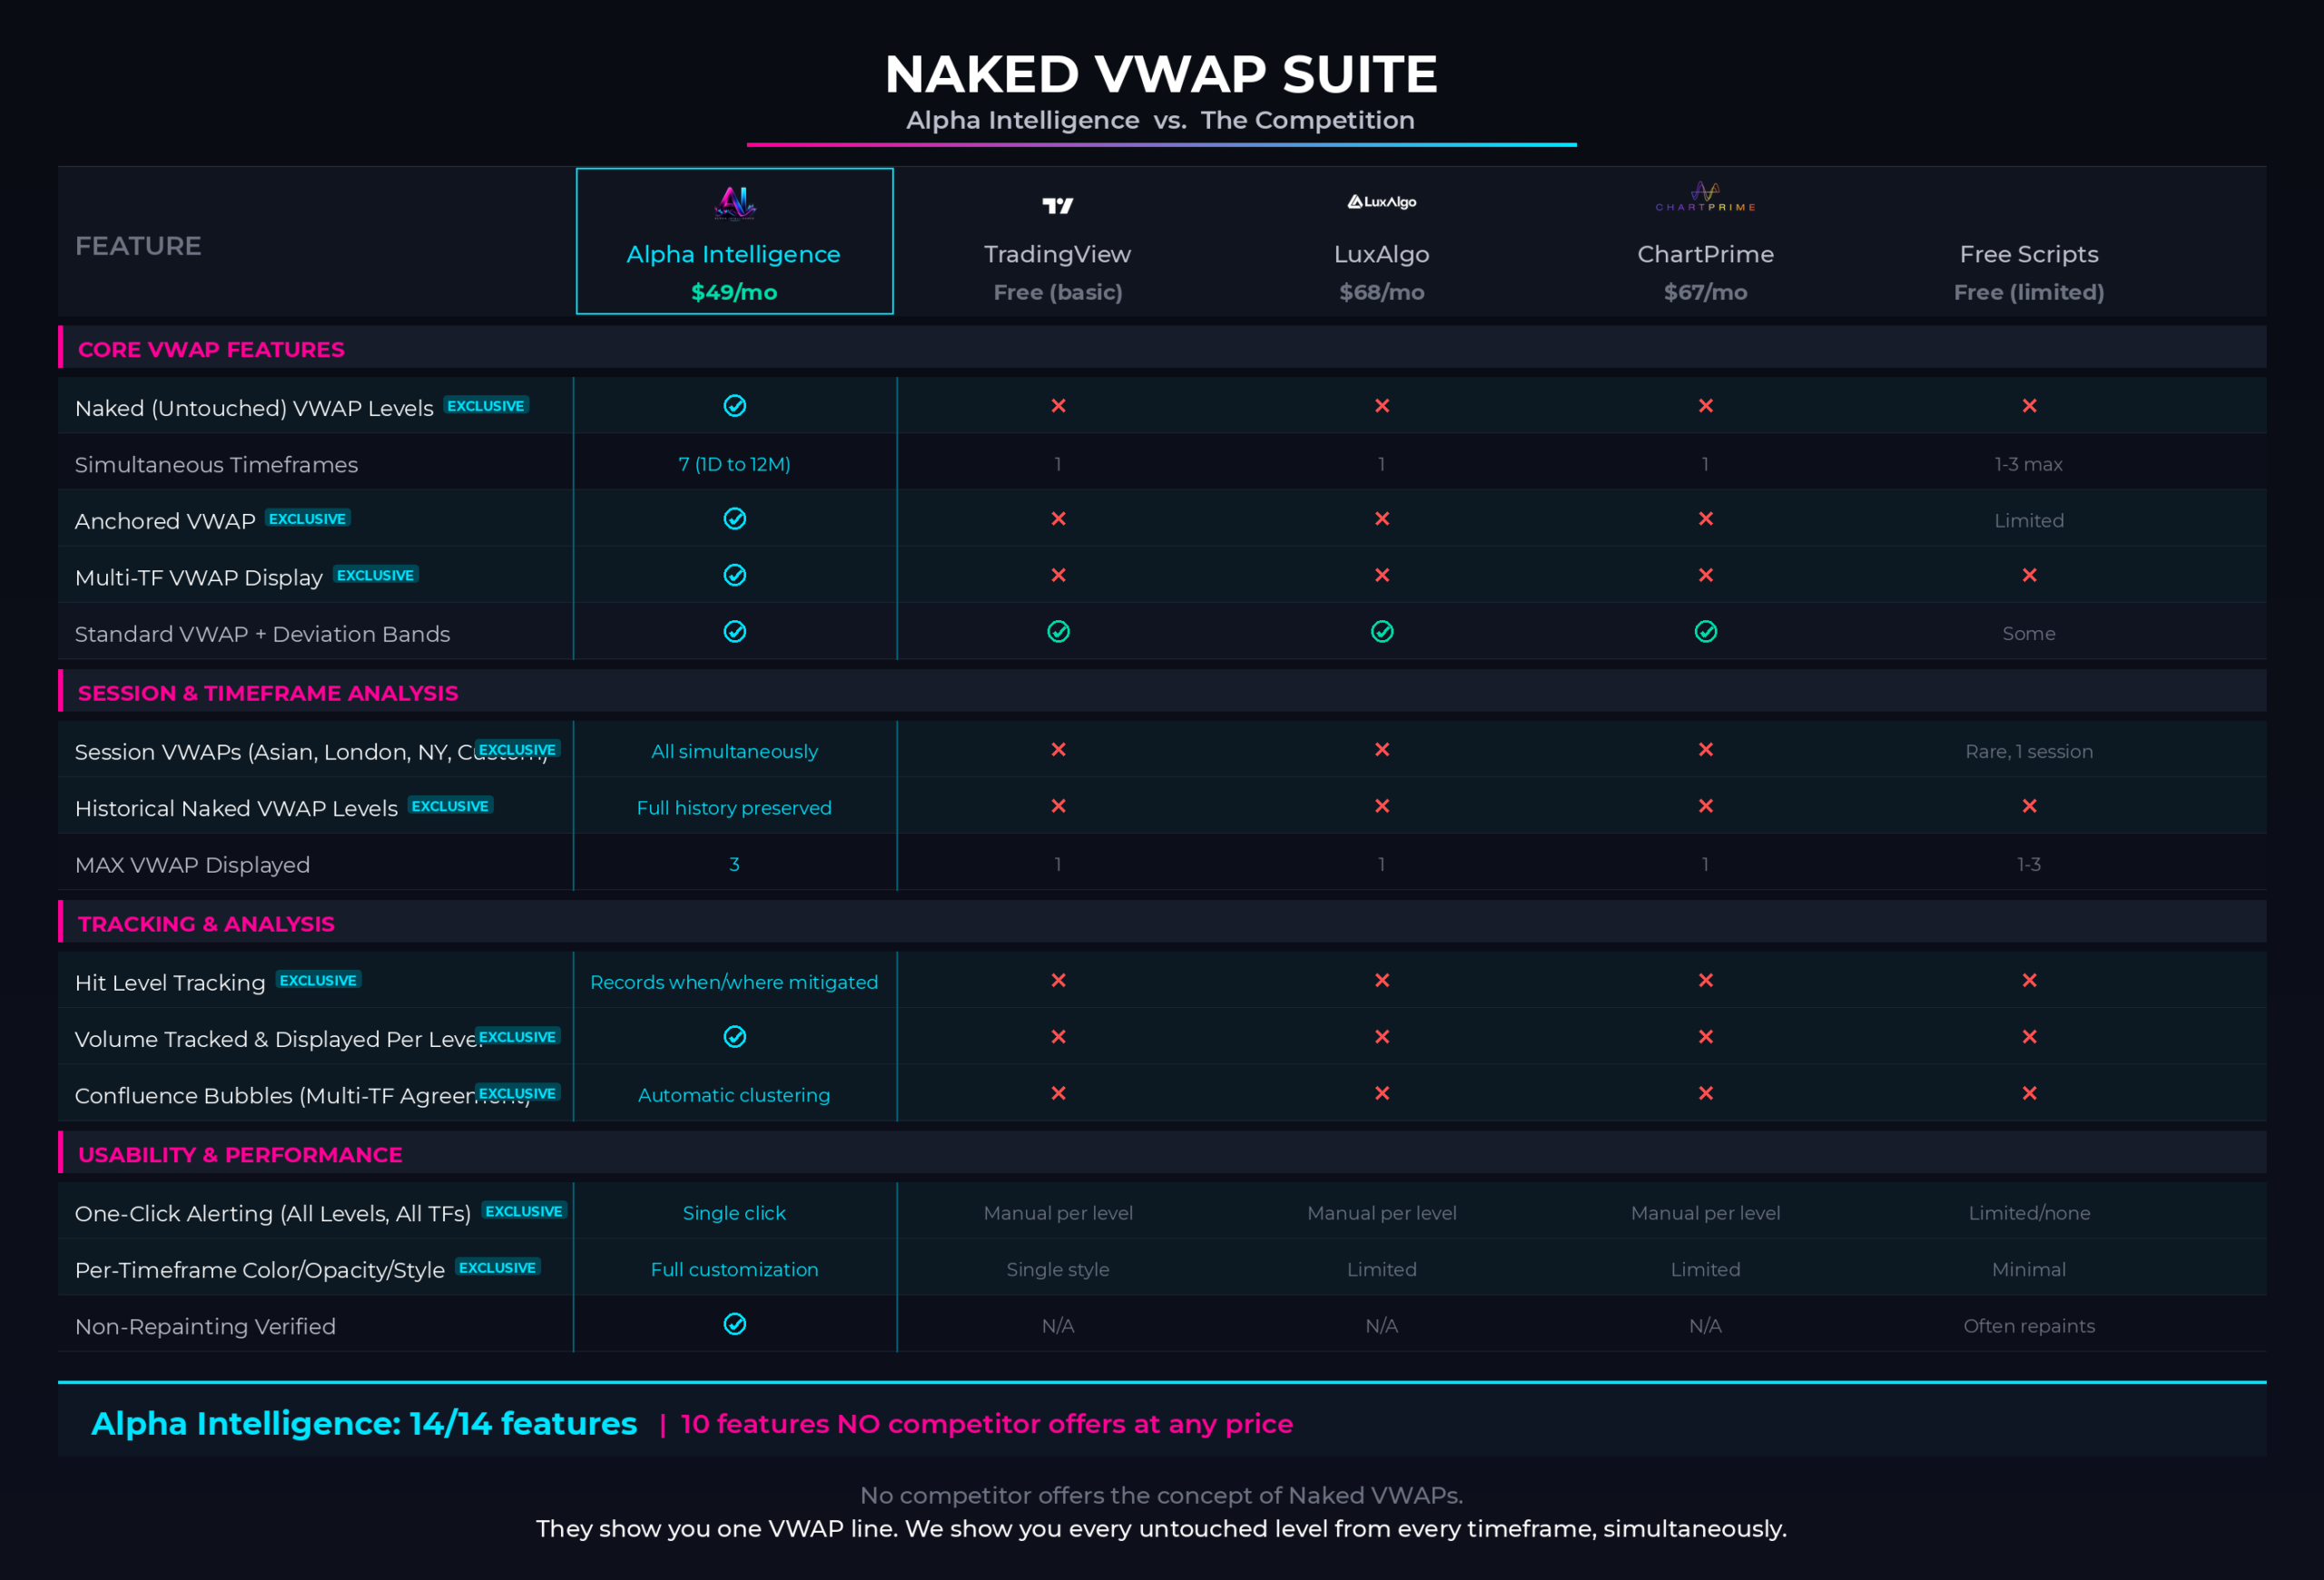
WHAT IS INCLUDED IN NAKED VWAP SUITE?
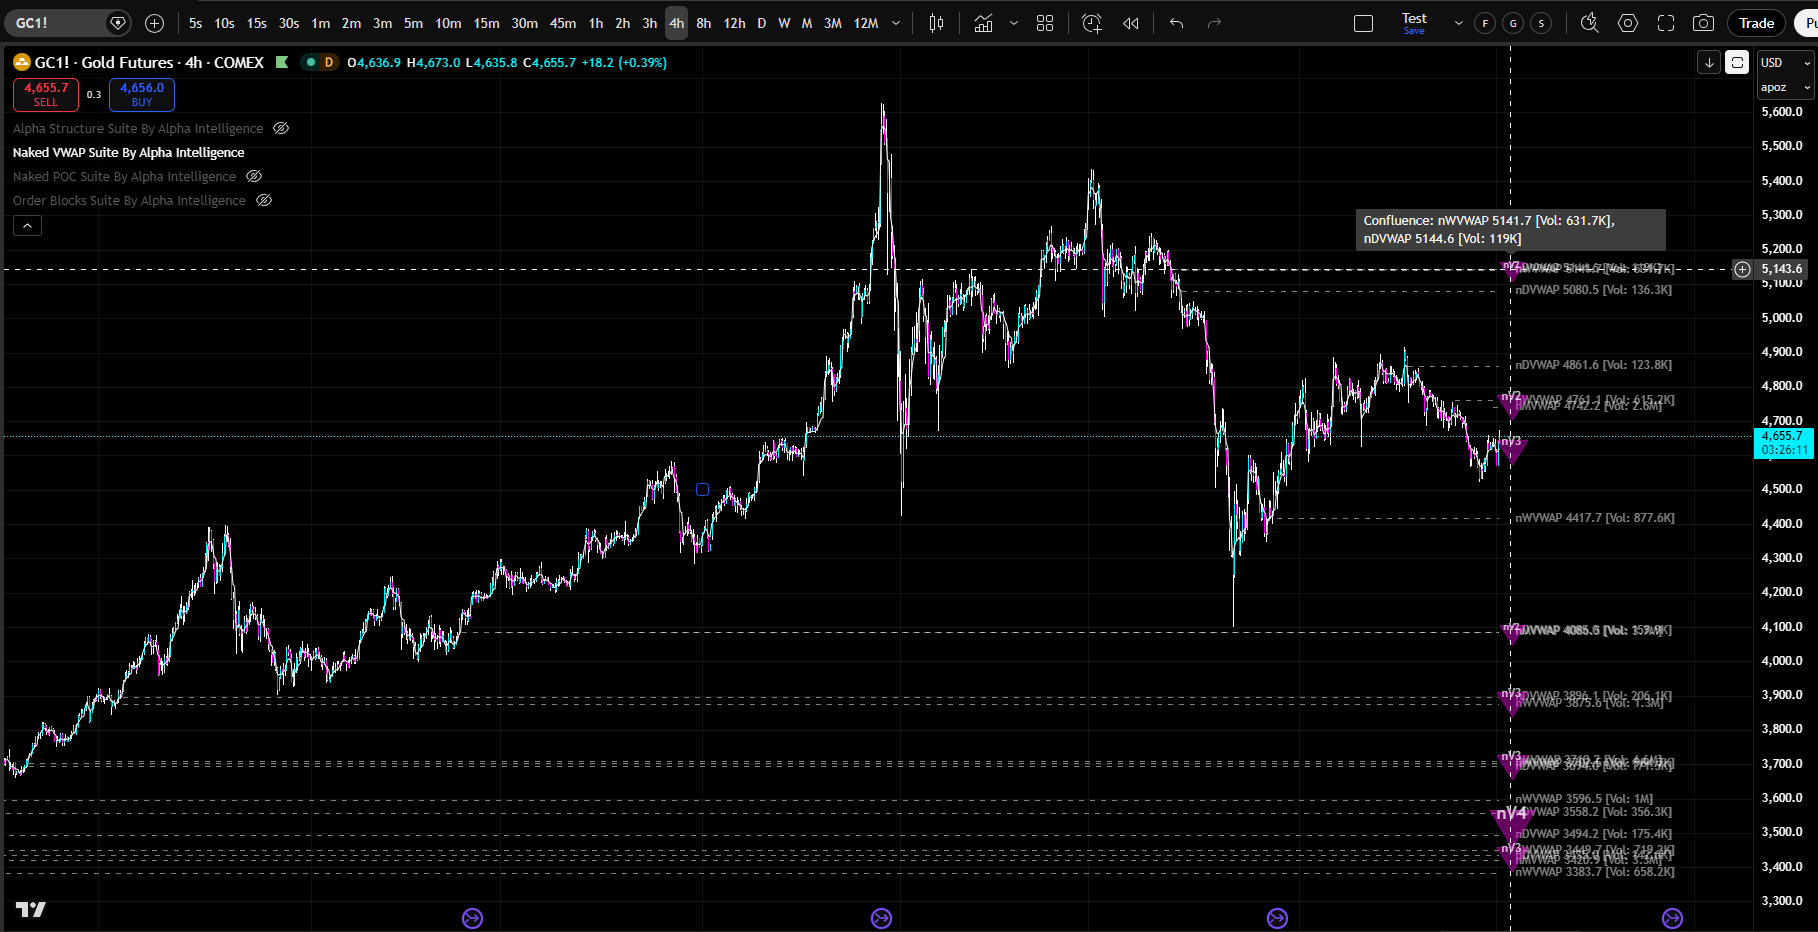
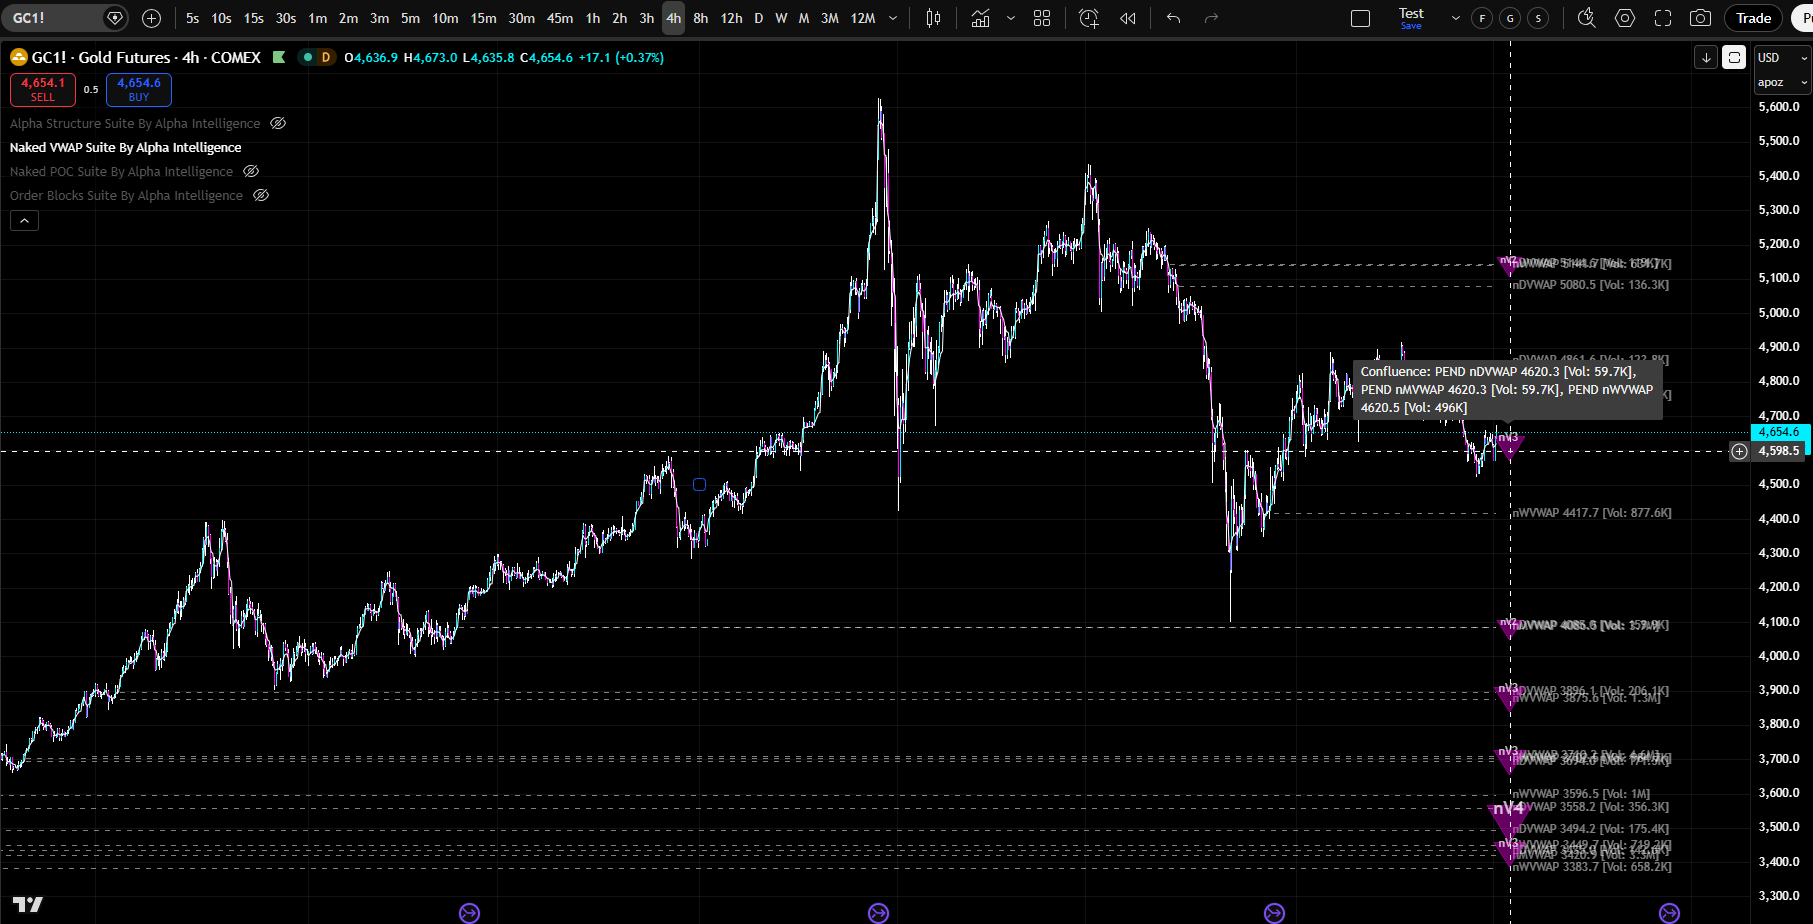
WHAT DOES NAKED VWAP SUITE AUTOMATICALLY PLOT ON YOUR CHART?
FULL CUSTOMIZATION & CONTROL
Are You Ready To Trade With Institutional Precision?
Enter Your Email And Subscribe To All Alerts And Trainings (Free To You)!
Once You Press Submit, BUCKLE UP Because You Are In For One Heck Of A Ride!
You're All Set!
Check Out The Video On This Page...
And JOIN US!
You can close this now. It will auto-close in 5 seconds.