Alpha Intelligence Indicators

Naked POC Suite Tutorial

Learn how to use Naked POC Suite to find where institutional traders spent the most time and trade high-probability POC zones.
Watch The Below Video!

Almost INSTANT TradingView access. Any chart. Any market. Cancel anytime.

Naked POC Suite Complete Institutional Indicator Tutorial

What You Will Learn

In this tutorial, you will learn how to use Naked POC Suite to identify exactly where institutional traders spent the most time at every timeframe:
– You will understand how to read Point of Control levels
– Identify Naked POC levels as a magnet for price
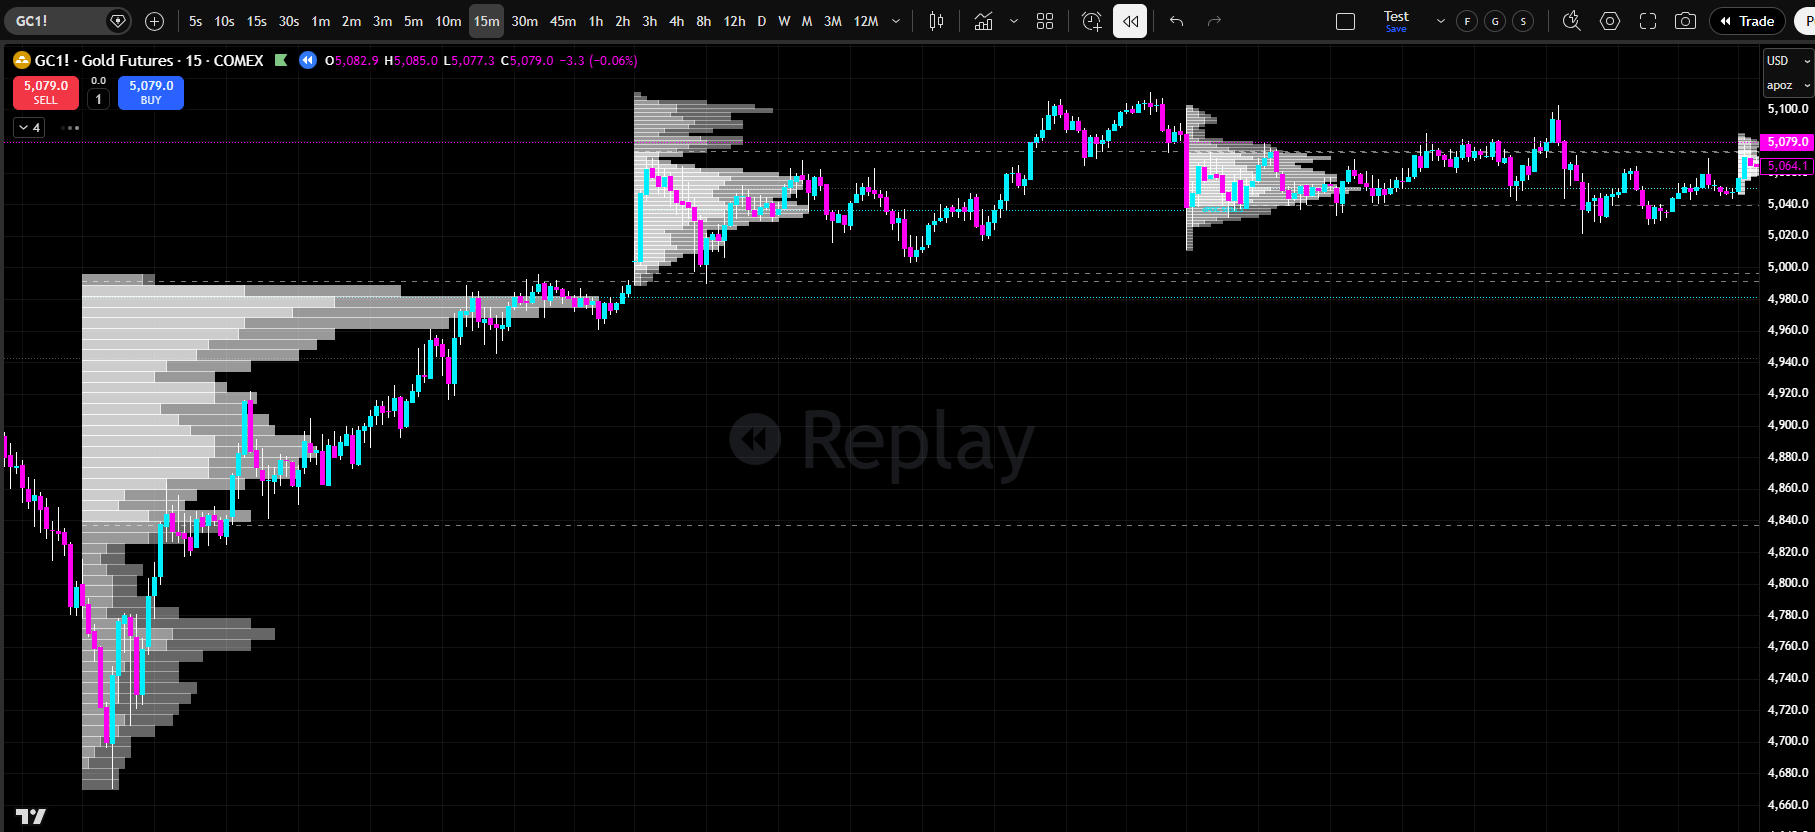
– Add Multi-Timeframe Volume Profiles to your chart
– Find confluence zones where multiple timeframes agree on a price level.

Find the exact price levels institutions are defending — and where price is being pulled.

How Naked POC Works

 
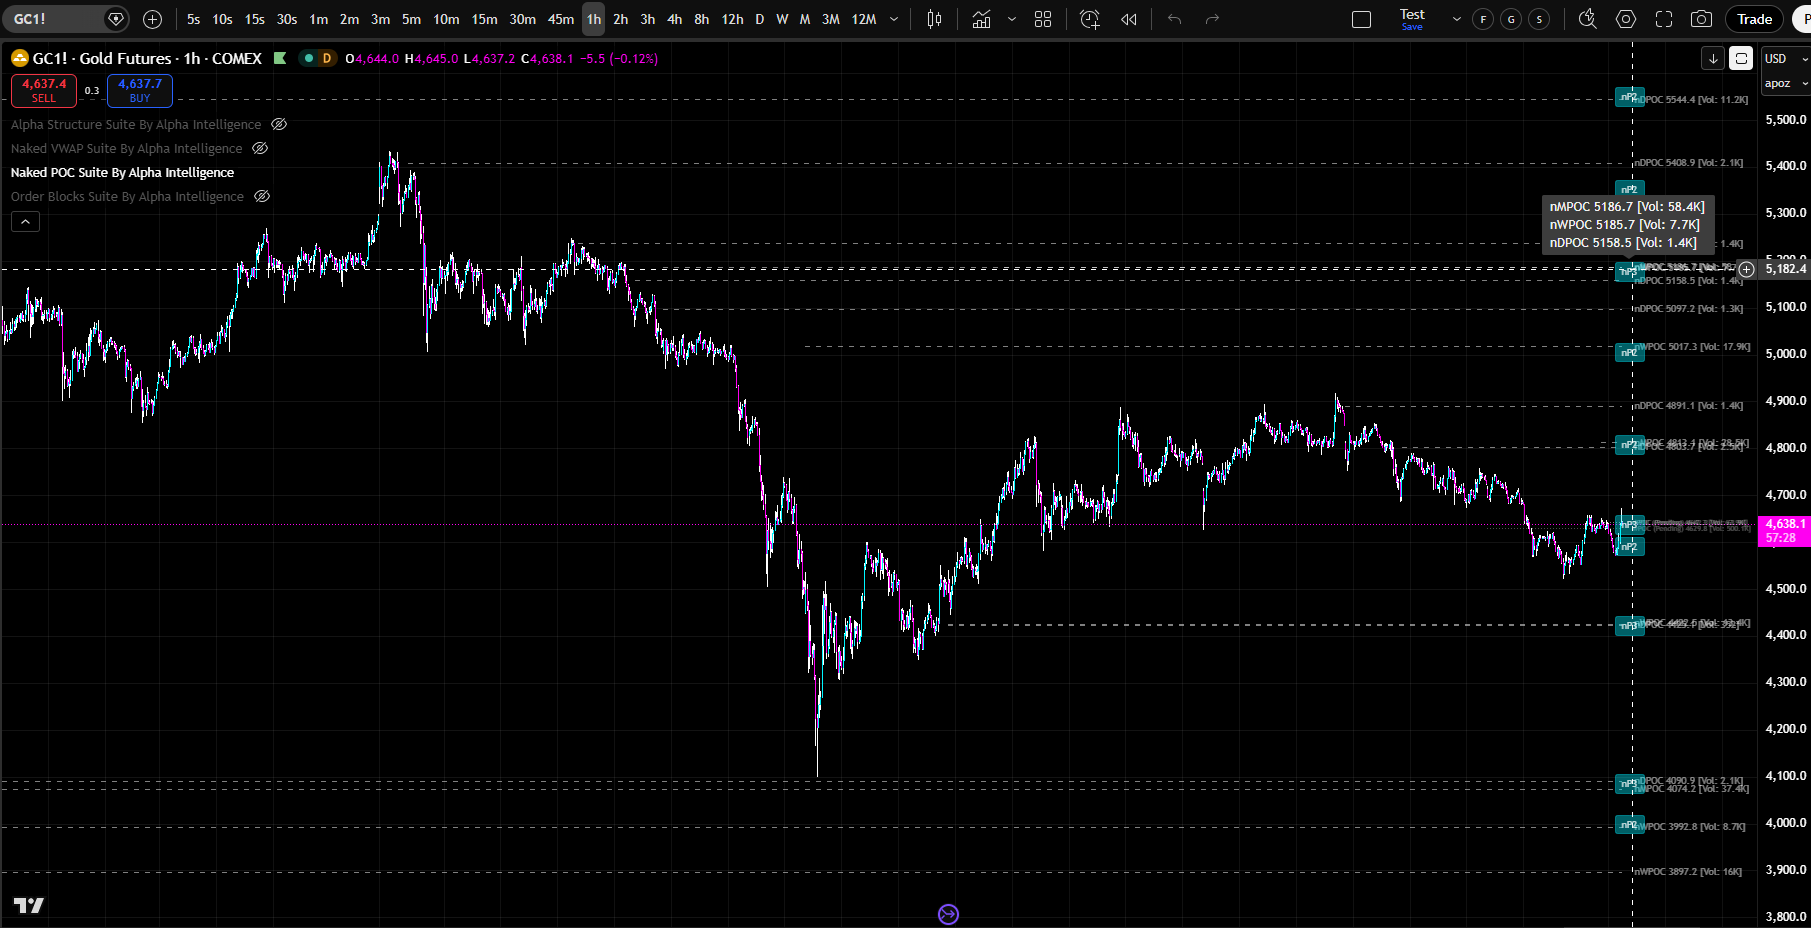
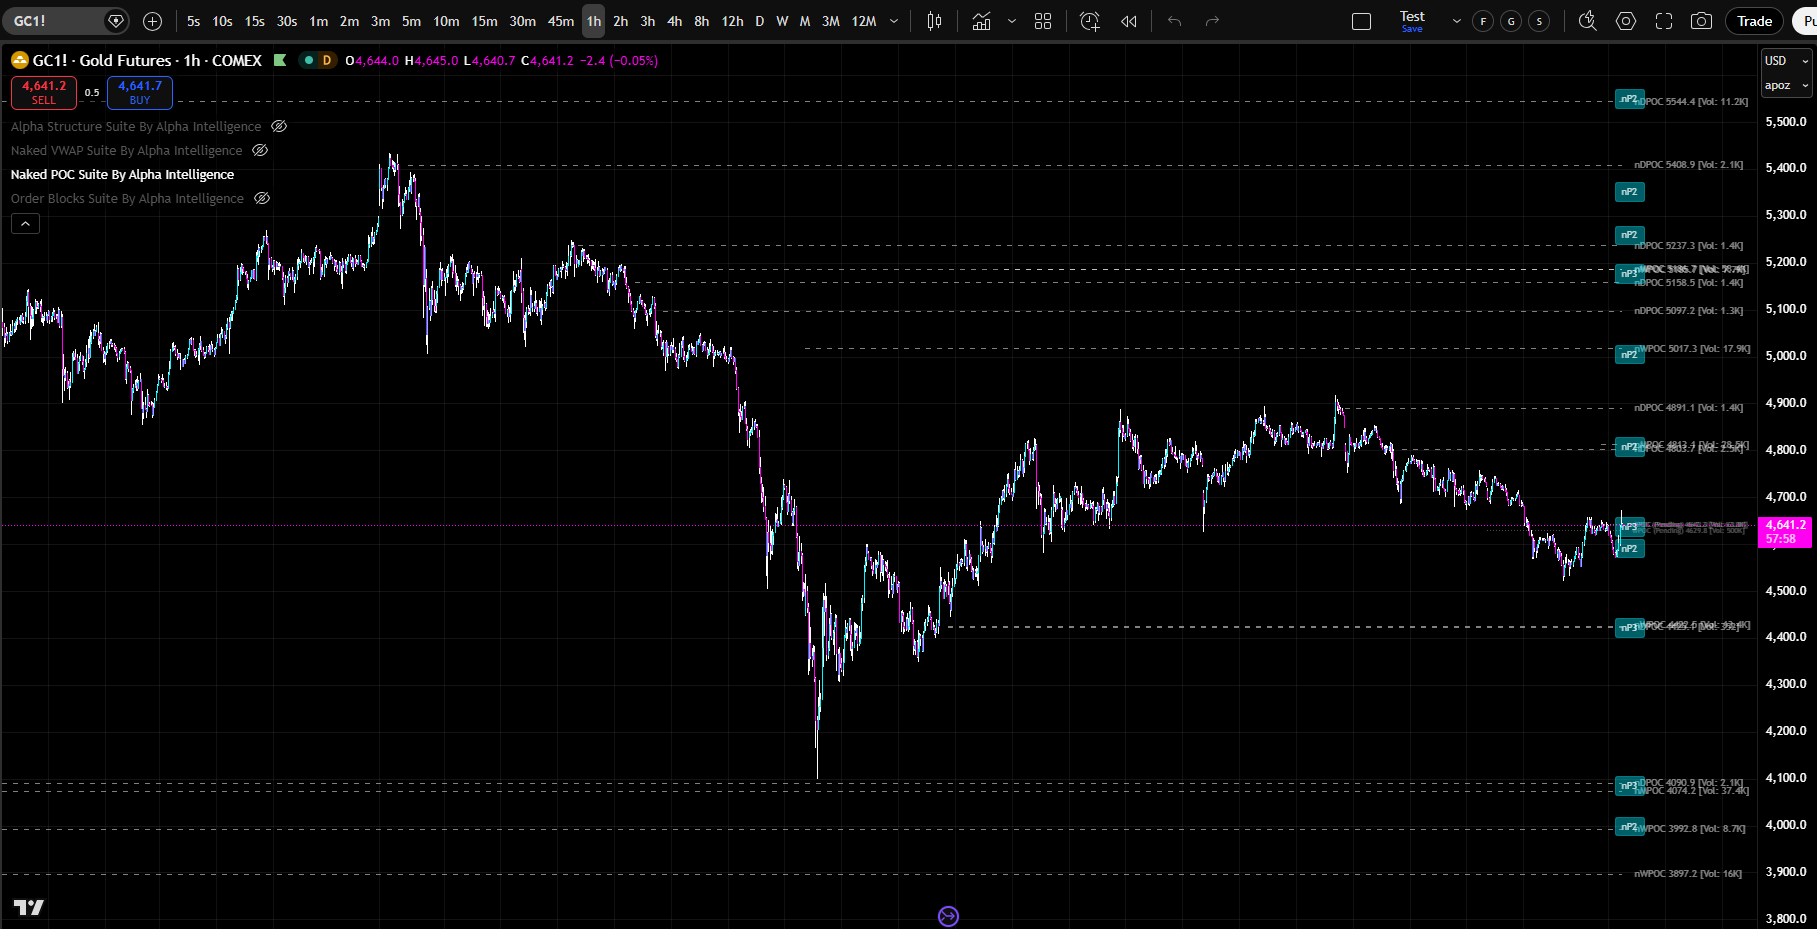
  • Naked POC Suite calculates Point of Control across up to ten simultaneous timeframes. POC is the price level where the most volume has traded — it is where institutional traders spent the most time. When price moves away from POC, it creates an imbalance. Institutional traders want to return to POC to fill orders. When price approaches POC, a reaction is likely.
    • The indicator displays POC levels for each enabled timeframe. Each line is independently customizable — choose colors, opacity, thickness, and style. When multiple POC lines cluster at the same price zone, that is institutional confluence. That is where the strongest reactions occur.
      The indicator detects POC breaks in real-time. When price closes decisively above or below POC, a new trend is forming. You receive real-time alerts so you never miss a break.
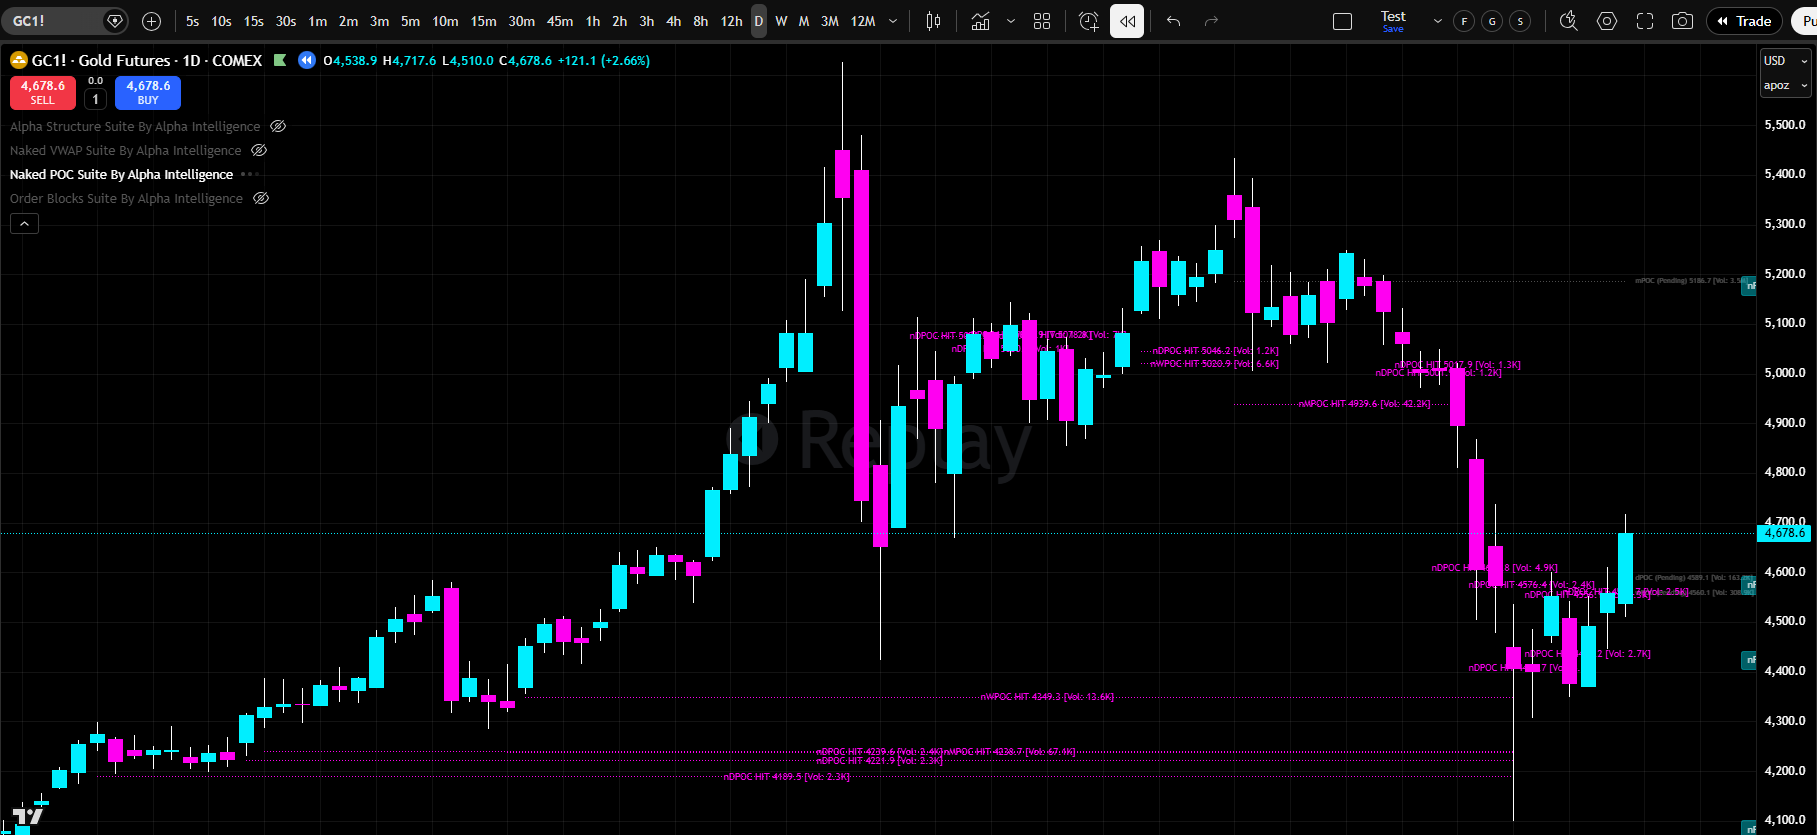
      Naked POC Suite displays historical POC levels from previous trading periods. See where POC was yesterday, last week, last month. Price has a memory — it returns to zones where significant volume has traded. Historical POC levels are where price is likely to react.
      The indicator identifies POC clusters where multiple POC levels from different timeframes cluster together. These are the highest-probability trading zones. When price approaches a POC cluster, prepare for a strong reaction.
    •  
    • Start by enabling the timeframes that match your trading style. Scalpers might use 1m, 2m, 3m, 5m, 10m, 15m, 30m, 1H, 2H, 4H. Day traders might use 5m, 15m, 30m, 1H, 4H, D. Swing traders might use 1H, 4H, D, W, M.
      Look for POC confluence zones where multiple timeframes have POC levels at the same price. These are high-probability trading zones.
      When price approaches a confluence zone, prepare for a strong reaction.
      Watch for POC breaks. When price closes above POC on high volume, institutional buyers are stepping in. When price closes below POC on high volume, institutional sellers are stepping out. These are directional signals.
      Use POC as your primary reference level. When price is above POC, the bias is bullish. When price is below POC, the bias is bearish. Trade in the direction of the POC bias.
      Use historical POC levels as support and resistance. Price returns to zones where significant volume has traded. Historical POC is where price is likely to react.
    • Every POC level is independently customizable. Choose any color, any opacity, any line thickness, any line style. Highlight specific timeframes. Hide timeframes you don’t need. Build the exact trading interface you want.
      Enable real-time alerts to be notified when POC breaks occur, when POC confluence zones form, when price approaches POC. Never miss a trading opportunity.
      •  
      Load Naked POC Suite on your chart. Enable the timeframes that match your trading style. Practice identifying POC confluence zones. Watch for POC breaks. Use historical POC as support and resistance. Start trading with institutional precision.

Click The Image Below To Go To The “Full Product Specs Page”

THE COMPETITION DOESN'T COMPARE... AND IT IS NOT EVEN CLOSE

How Does Naked POC Suite
Stack Up Against The TOP Competition?

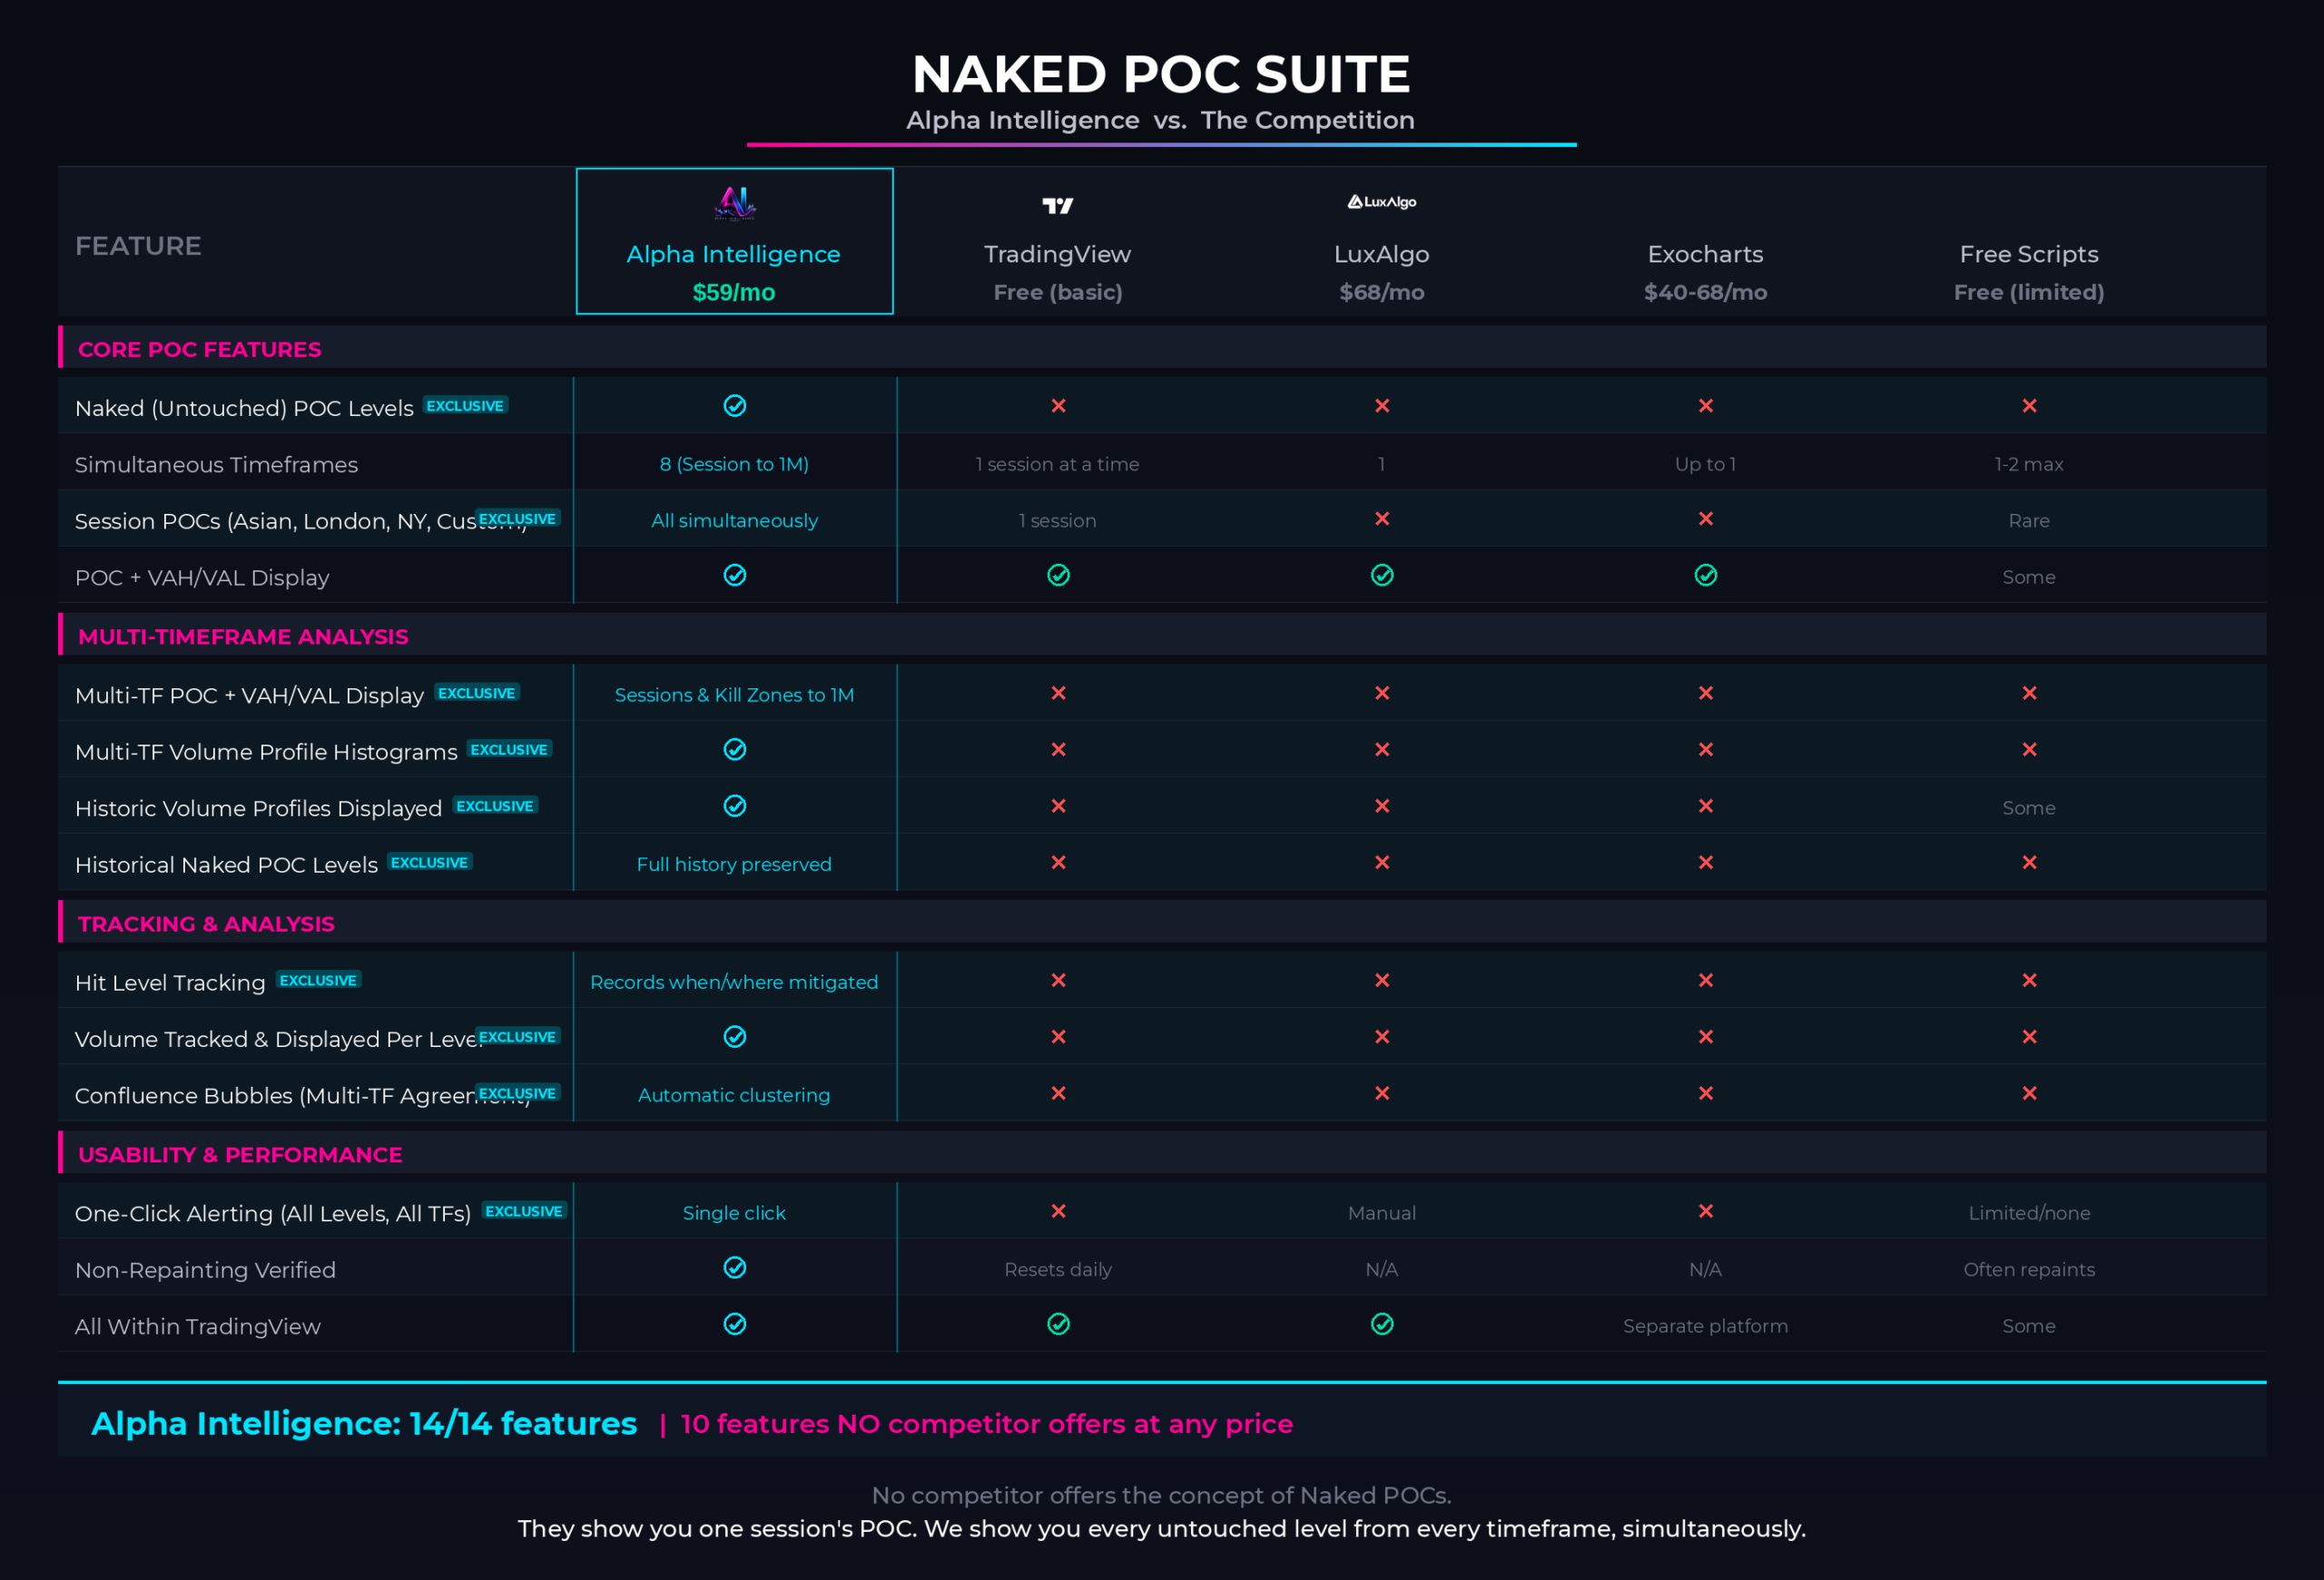
Naked POC Suite offers features that no other indicator on the market offers, and significantly outperforms anything available to date. Here is how… 
*Click on the image below to zoom in.*

  •  
  • There is not a SINGLE indicator in the market that actually offers the “Naked Institutional POC Levels” OR “Multi-TF Volume Profile Displays”. Every wondered… WHY?
  • Consistently outperforms LuxAlgo’s Volume Profile & POC Indicators. 
  • Consistently outperforms TradingView’s Built-In Volume Profile & POC Indicators.
  • Consistently outperforms ExoCharts’s Volume Profile & POC Indicators.
  • Consistently outperforms TradingView’s Free Library of Volume Profile & POC Indicators.
  • And it has 10 features that no other indicator in the ENTIRE indicator’s market offers.
  •  
GET STARTED TODAY

One Plan. Everything Included. Any Market.

$59 / month

Less than one bad trade.
Less than LuxAlgo’s single-tier plan.
Less than the cost of one month of “figuring it out yourself.”

No contracts. No hidden fees. Almost INSTANT TradingView access. Any chart. Any market. Cancel anytime. But You Won’t…

Scroll to Top