Learn how to use Alpha Structure Suite to identify market structure, confirmed levels, breaks, reversals, and swing failure patterns.
Watch The Below Video!
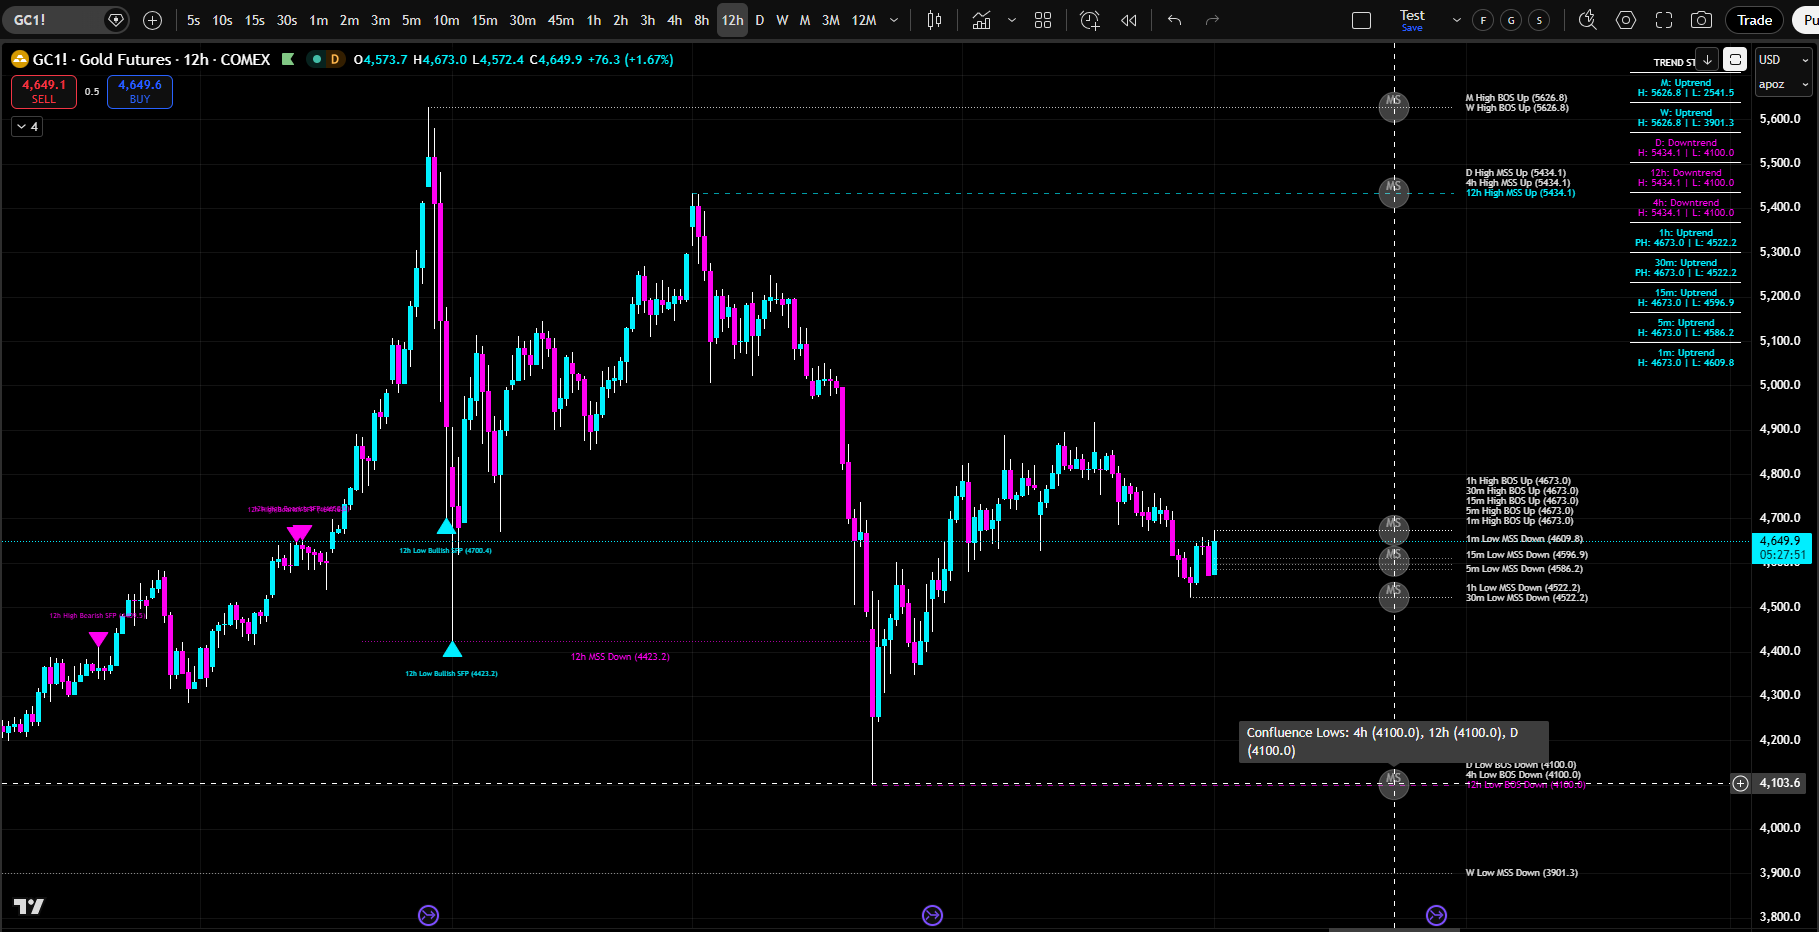
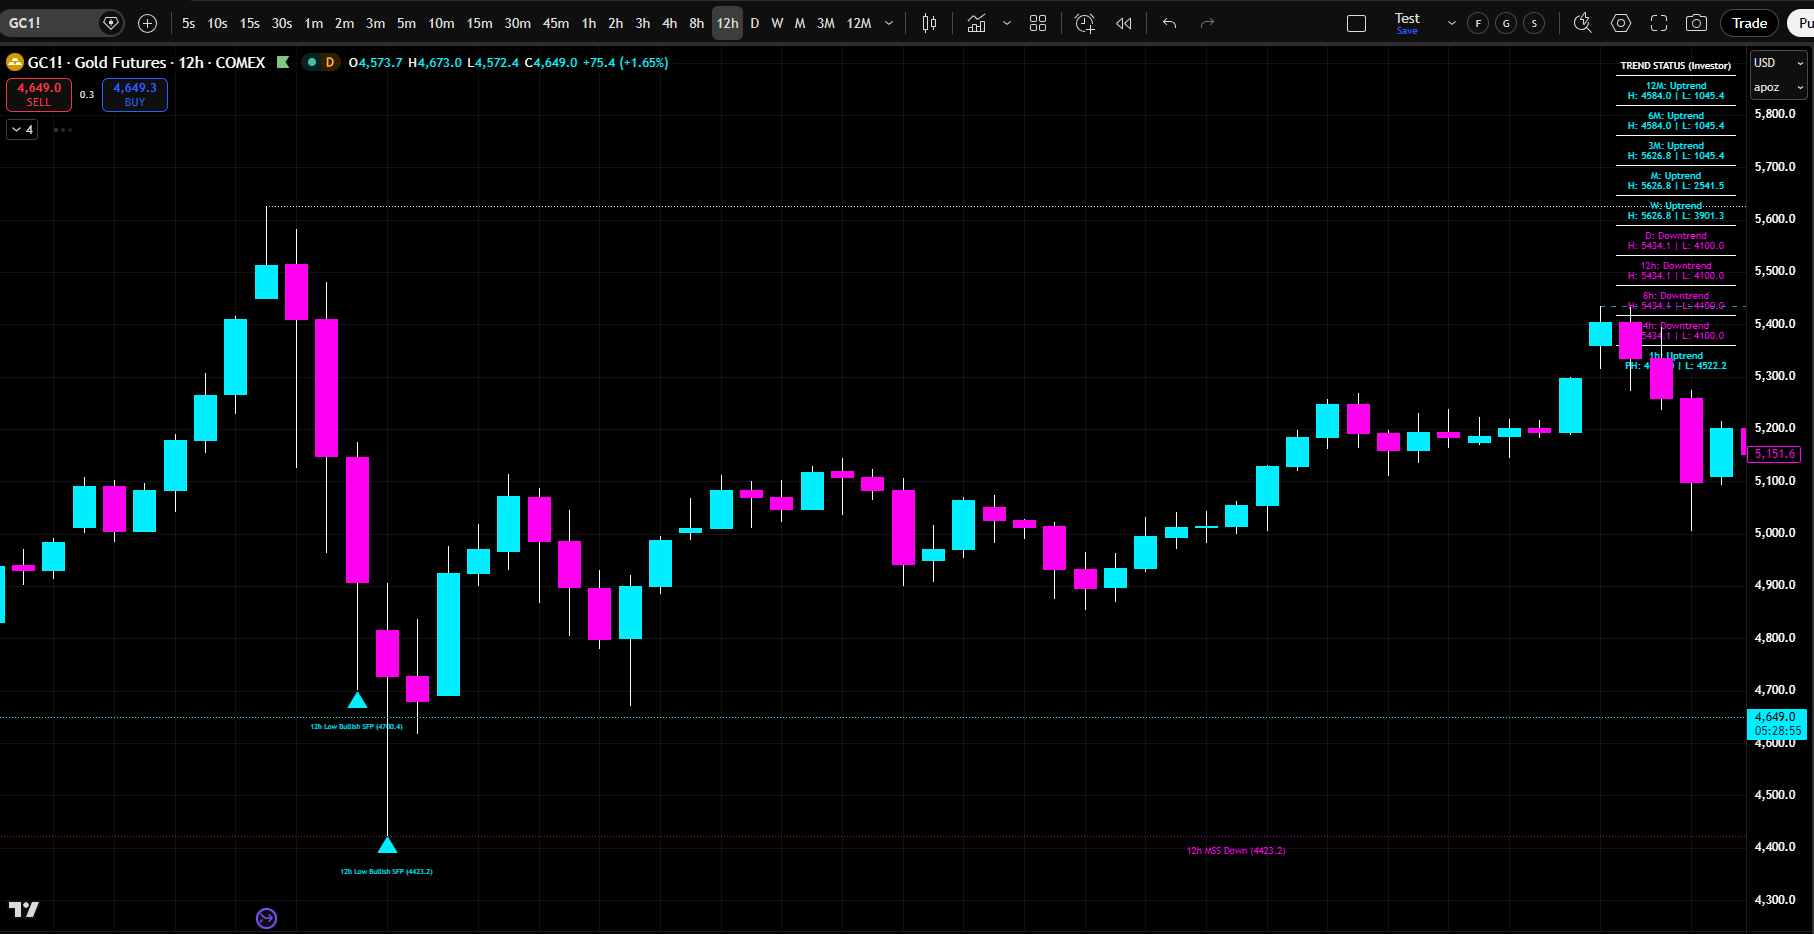
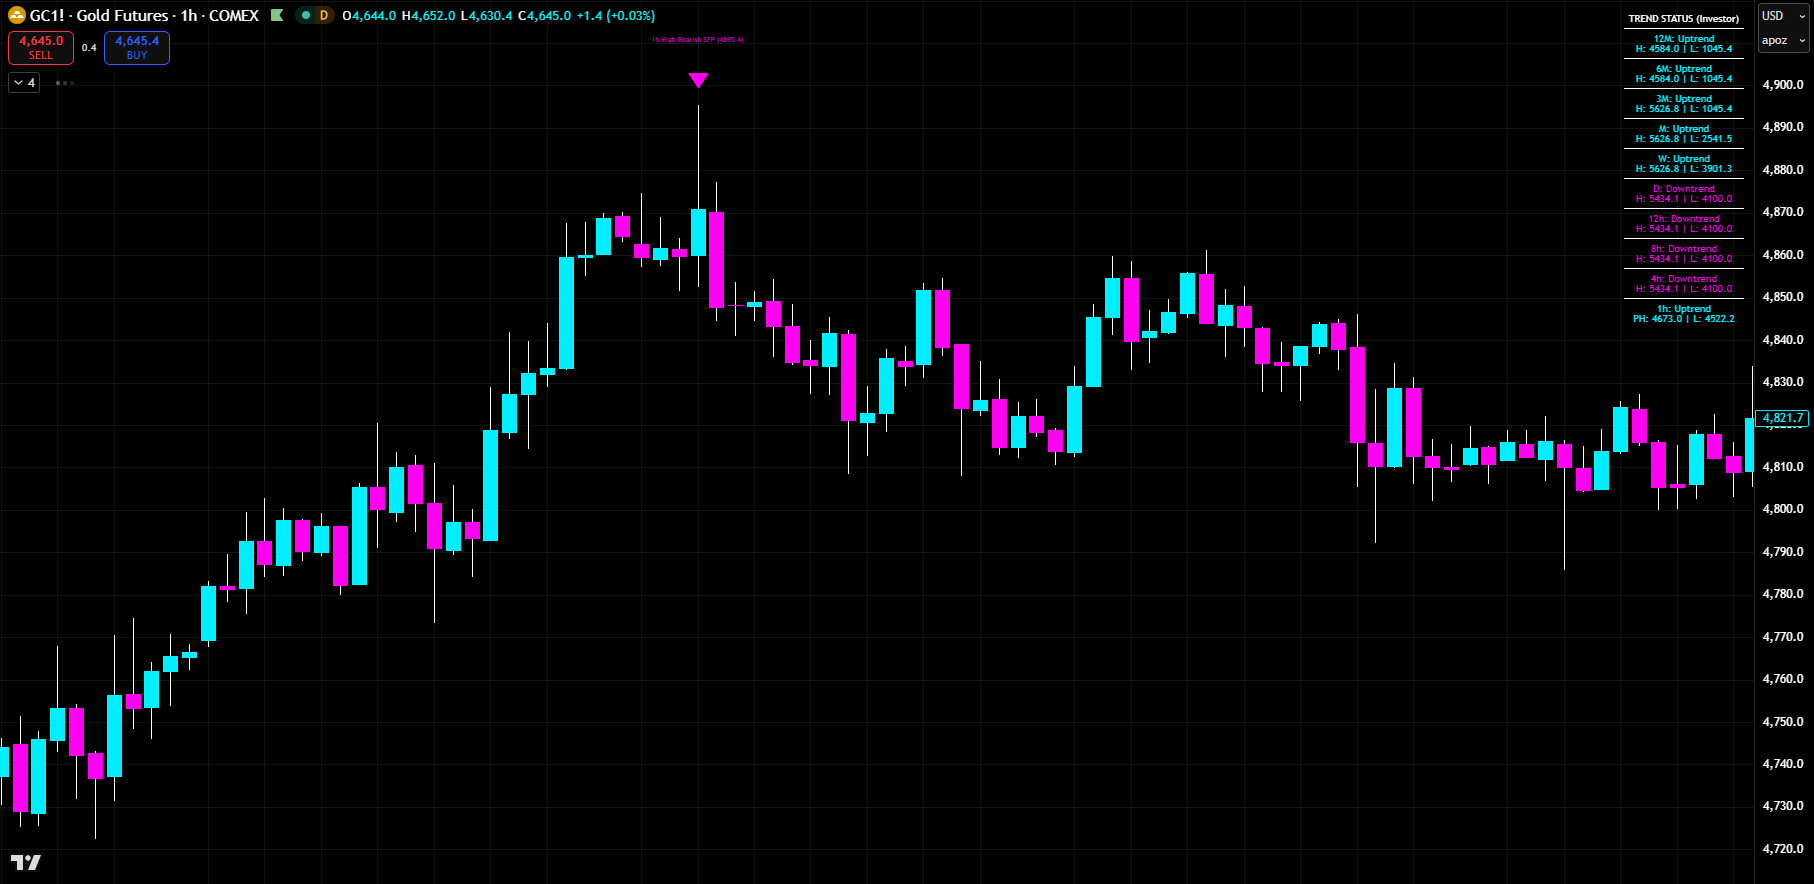
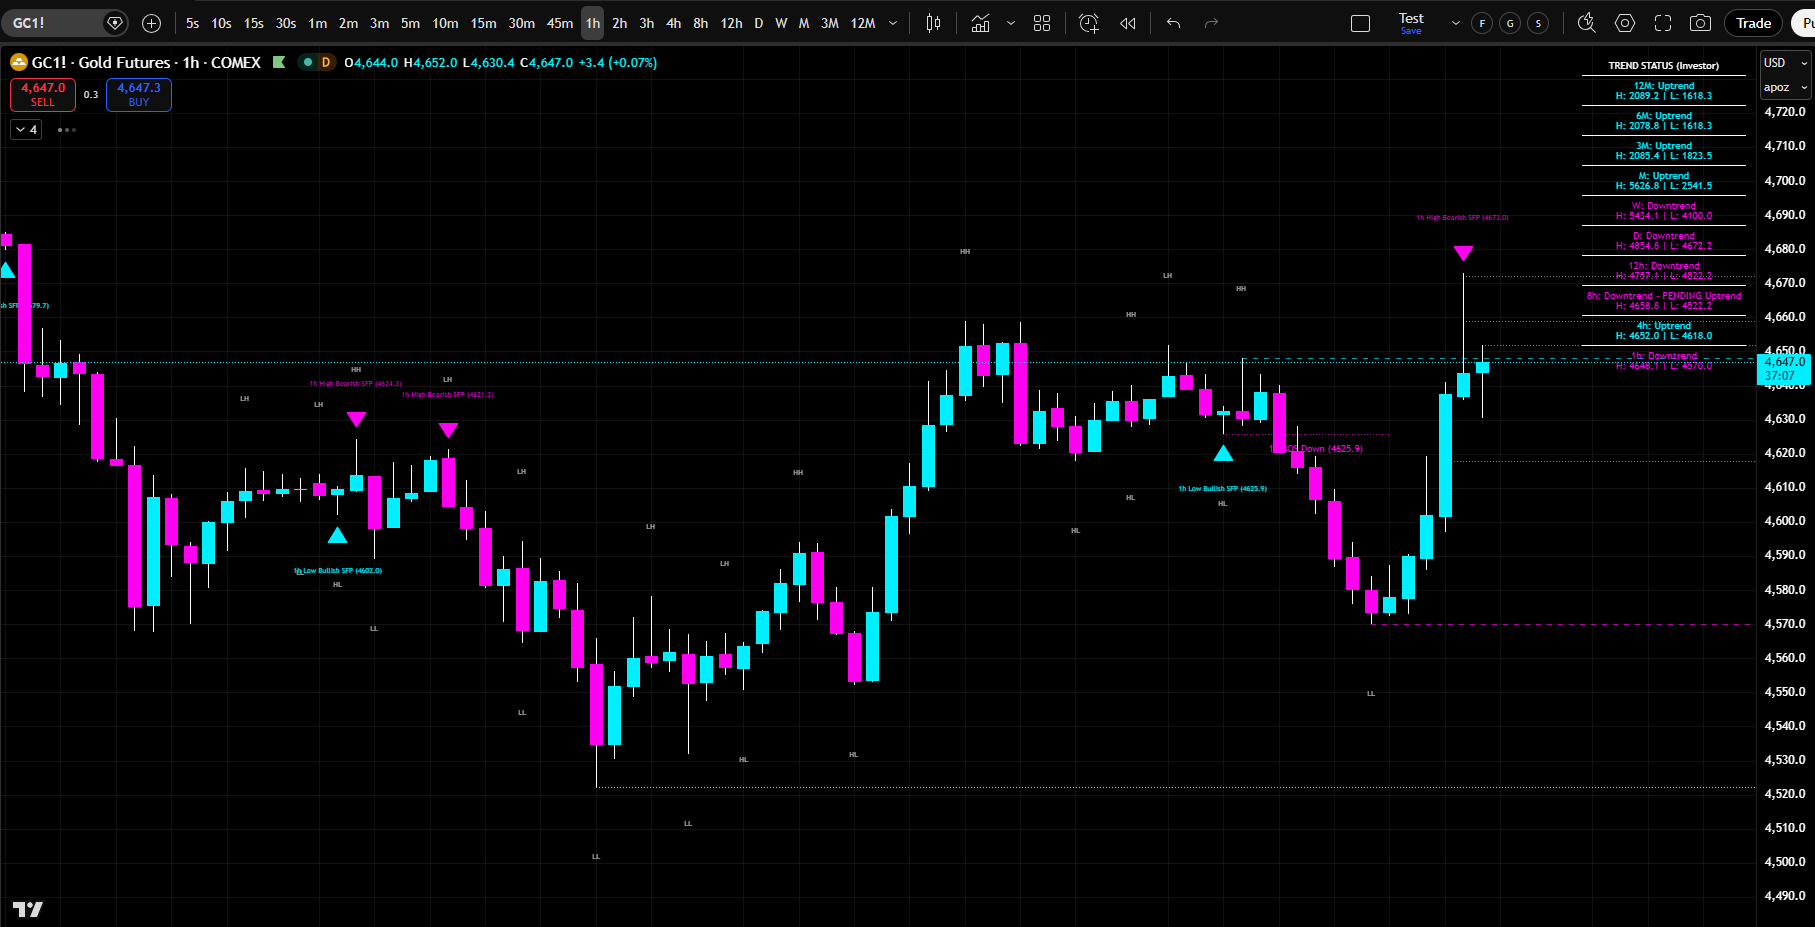
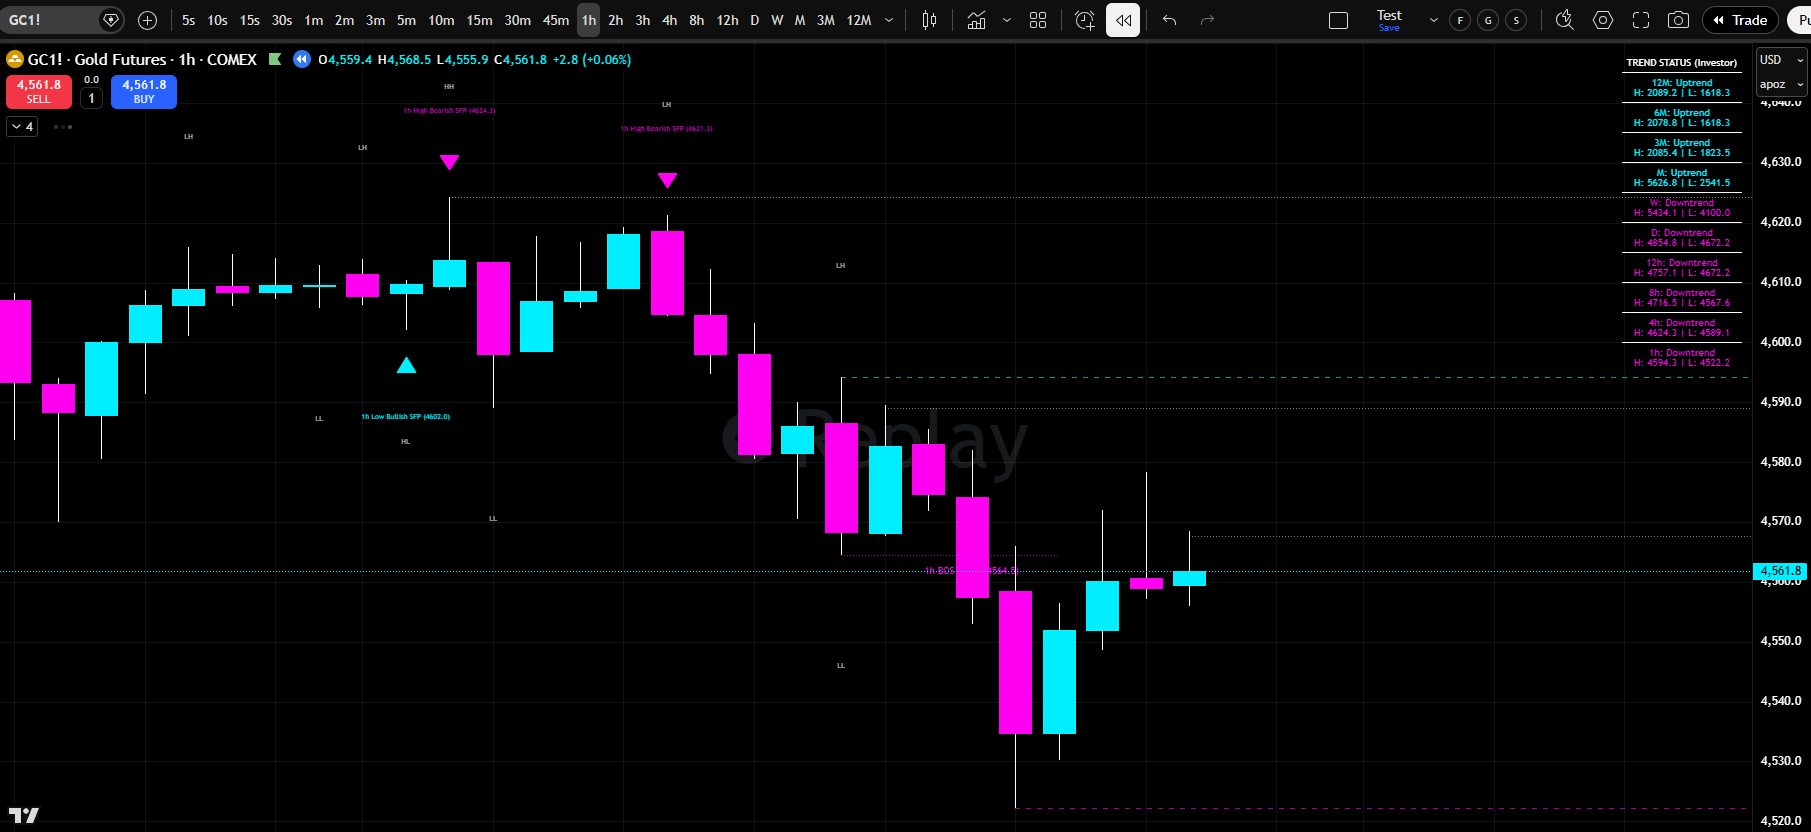
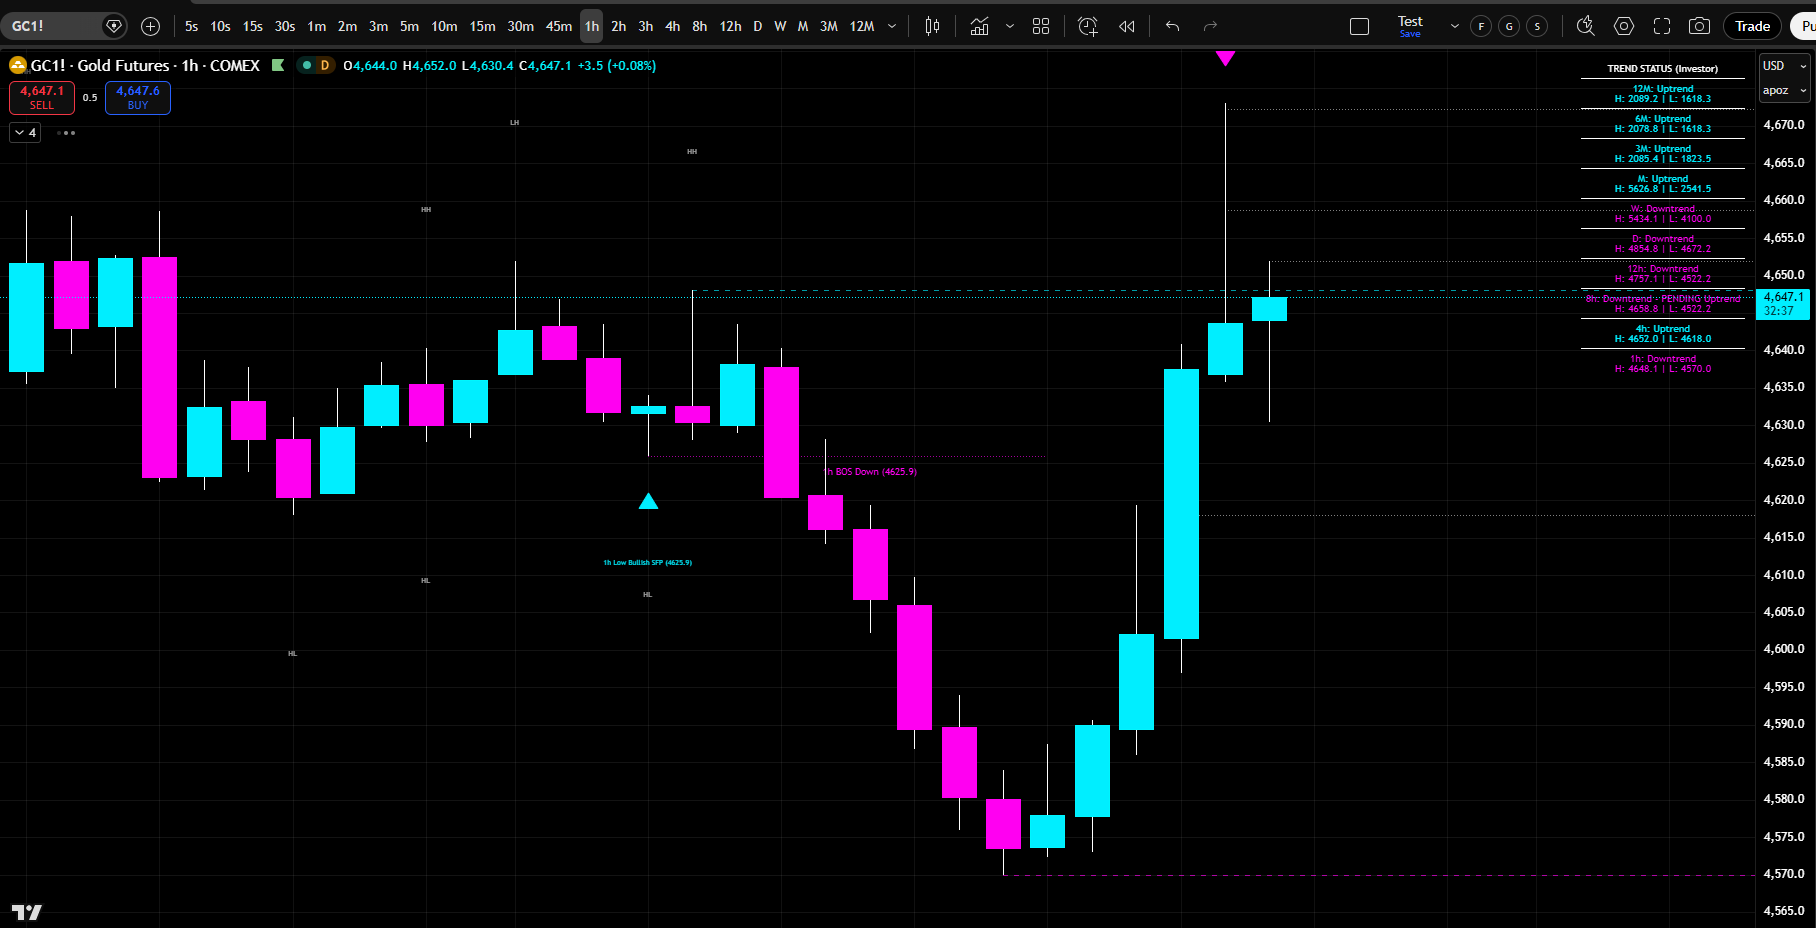
In this tutorial, you will learn how to use Alpha Structure Suite to read market structure like a professional trader:
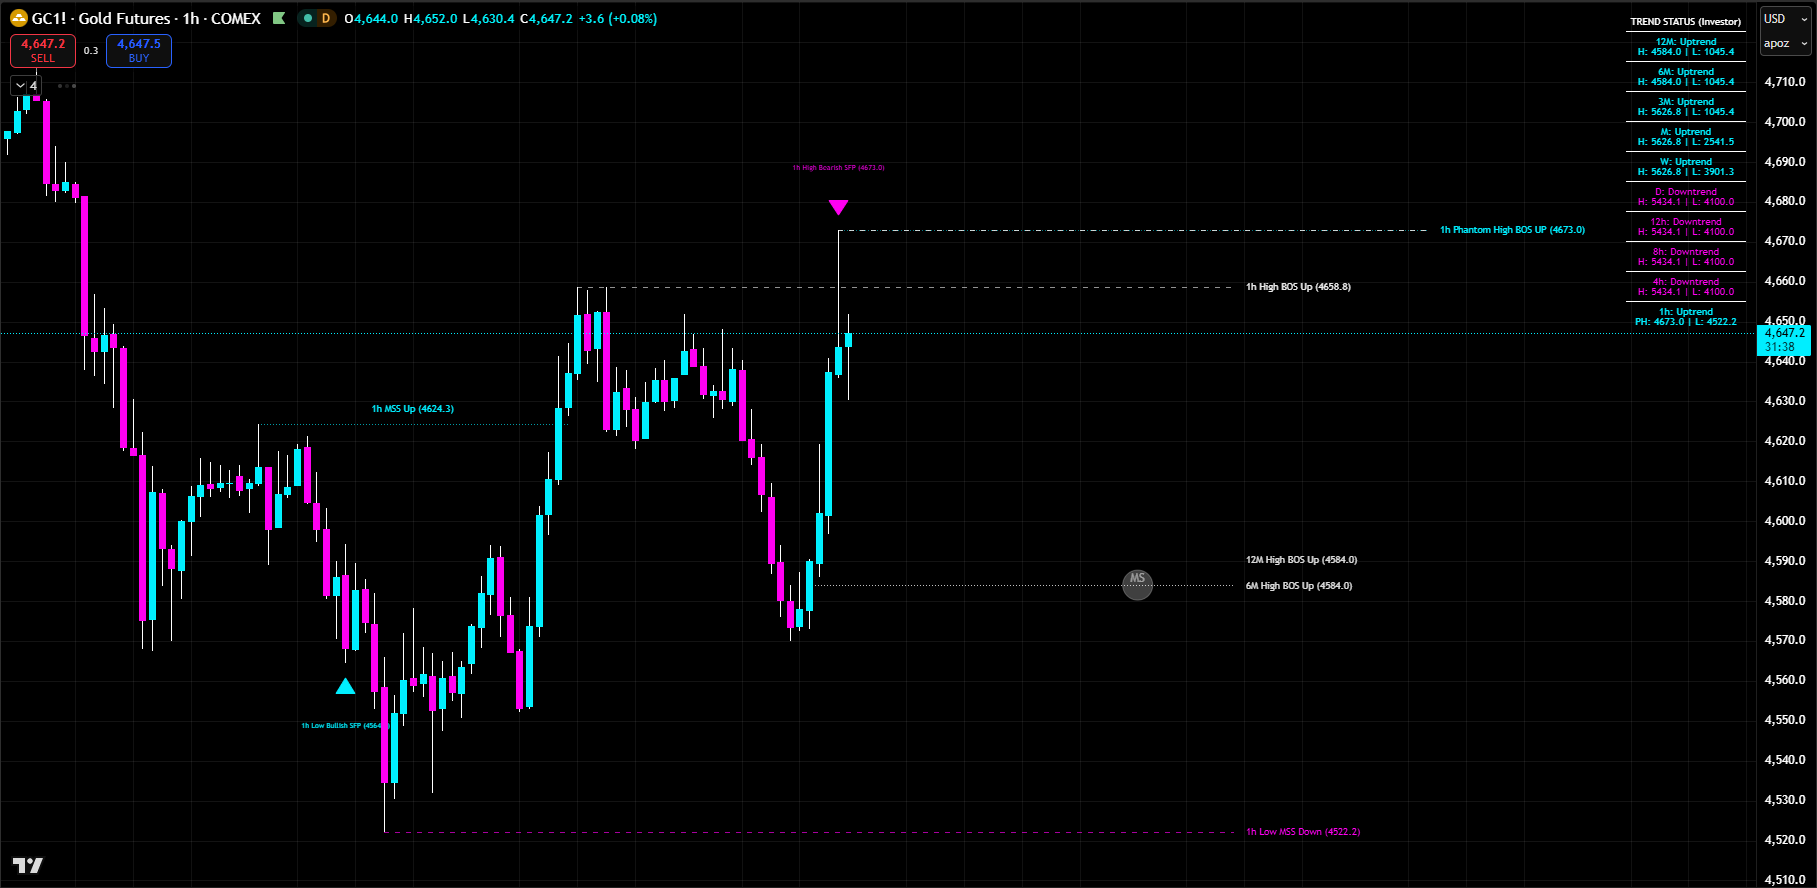
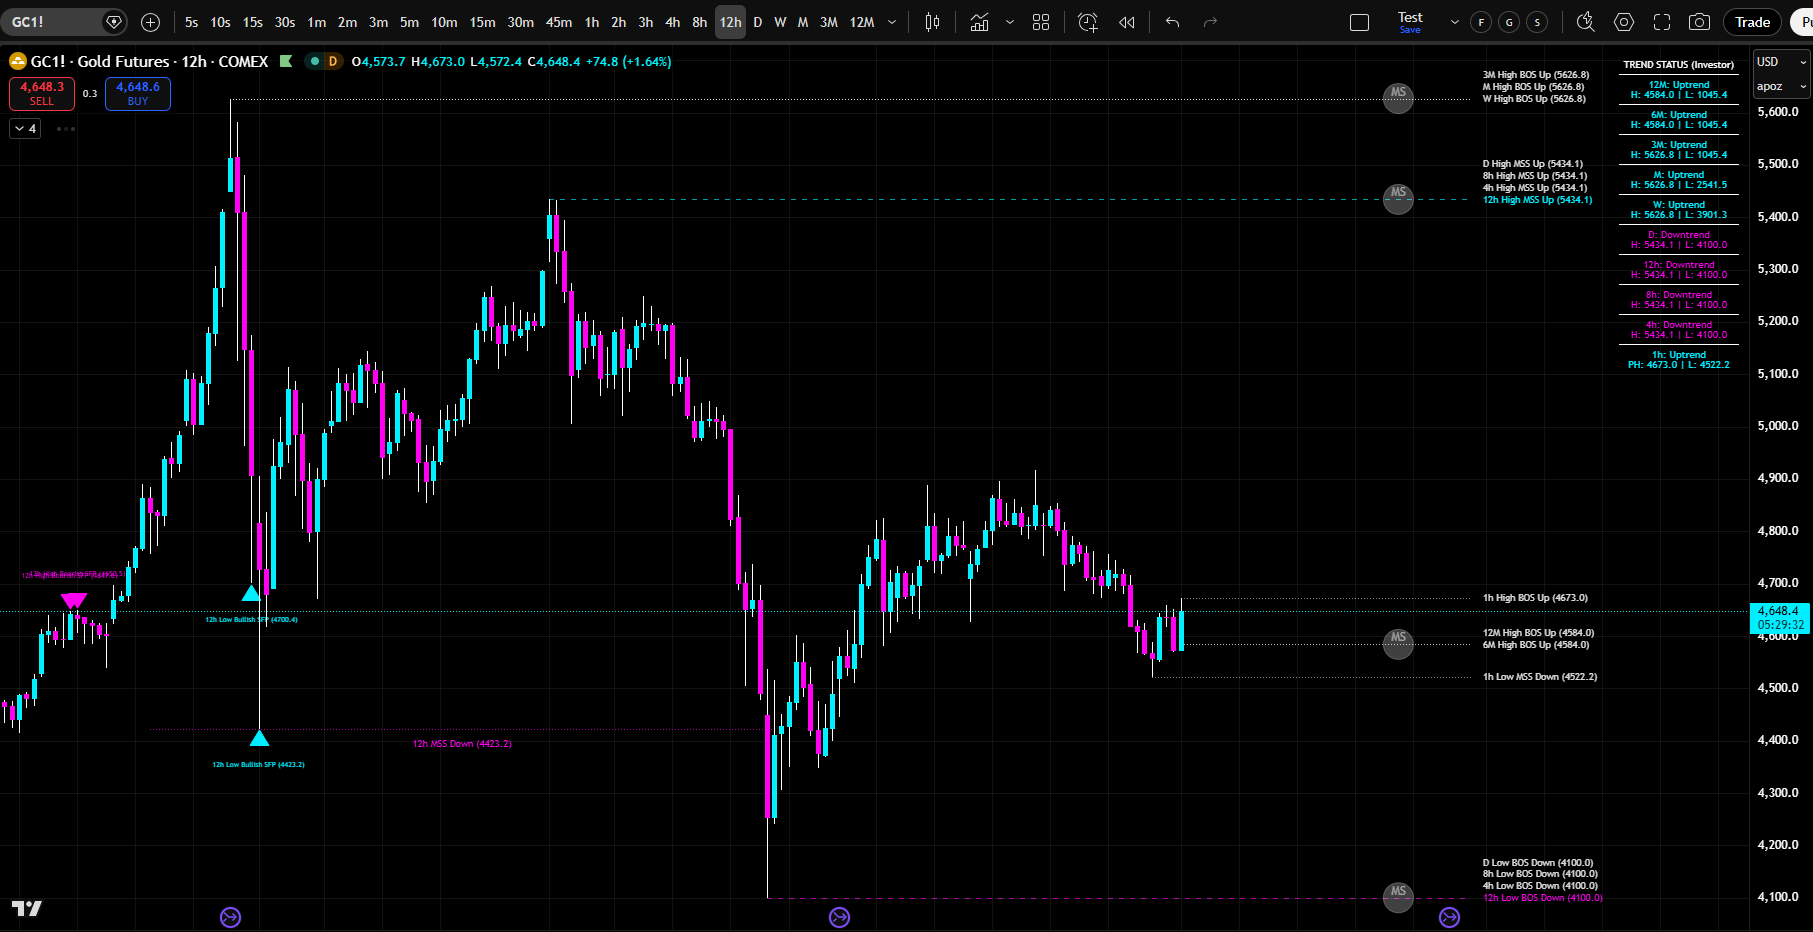
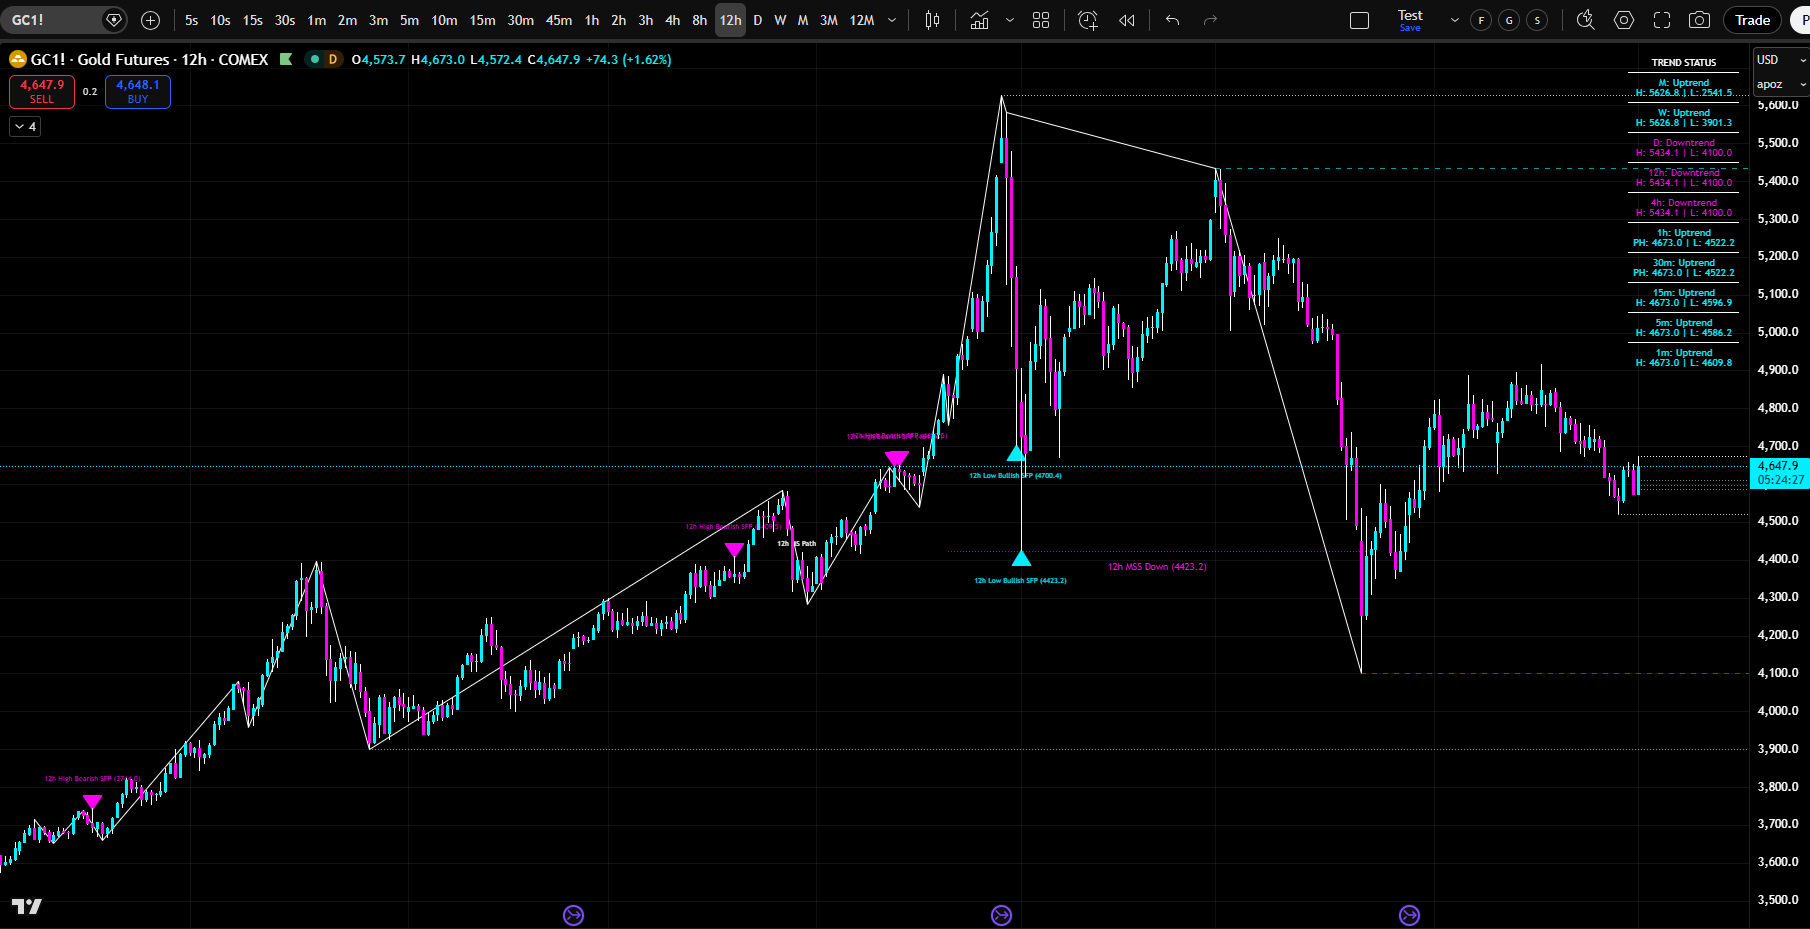
– Understand how to identify confirmed highs and lows
– Detect breaks of structure and market structure shifts
– Recognize swing failure patterns
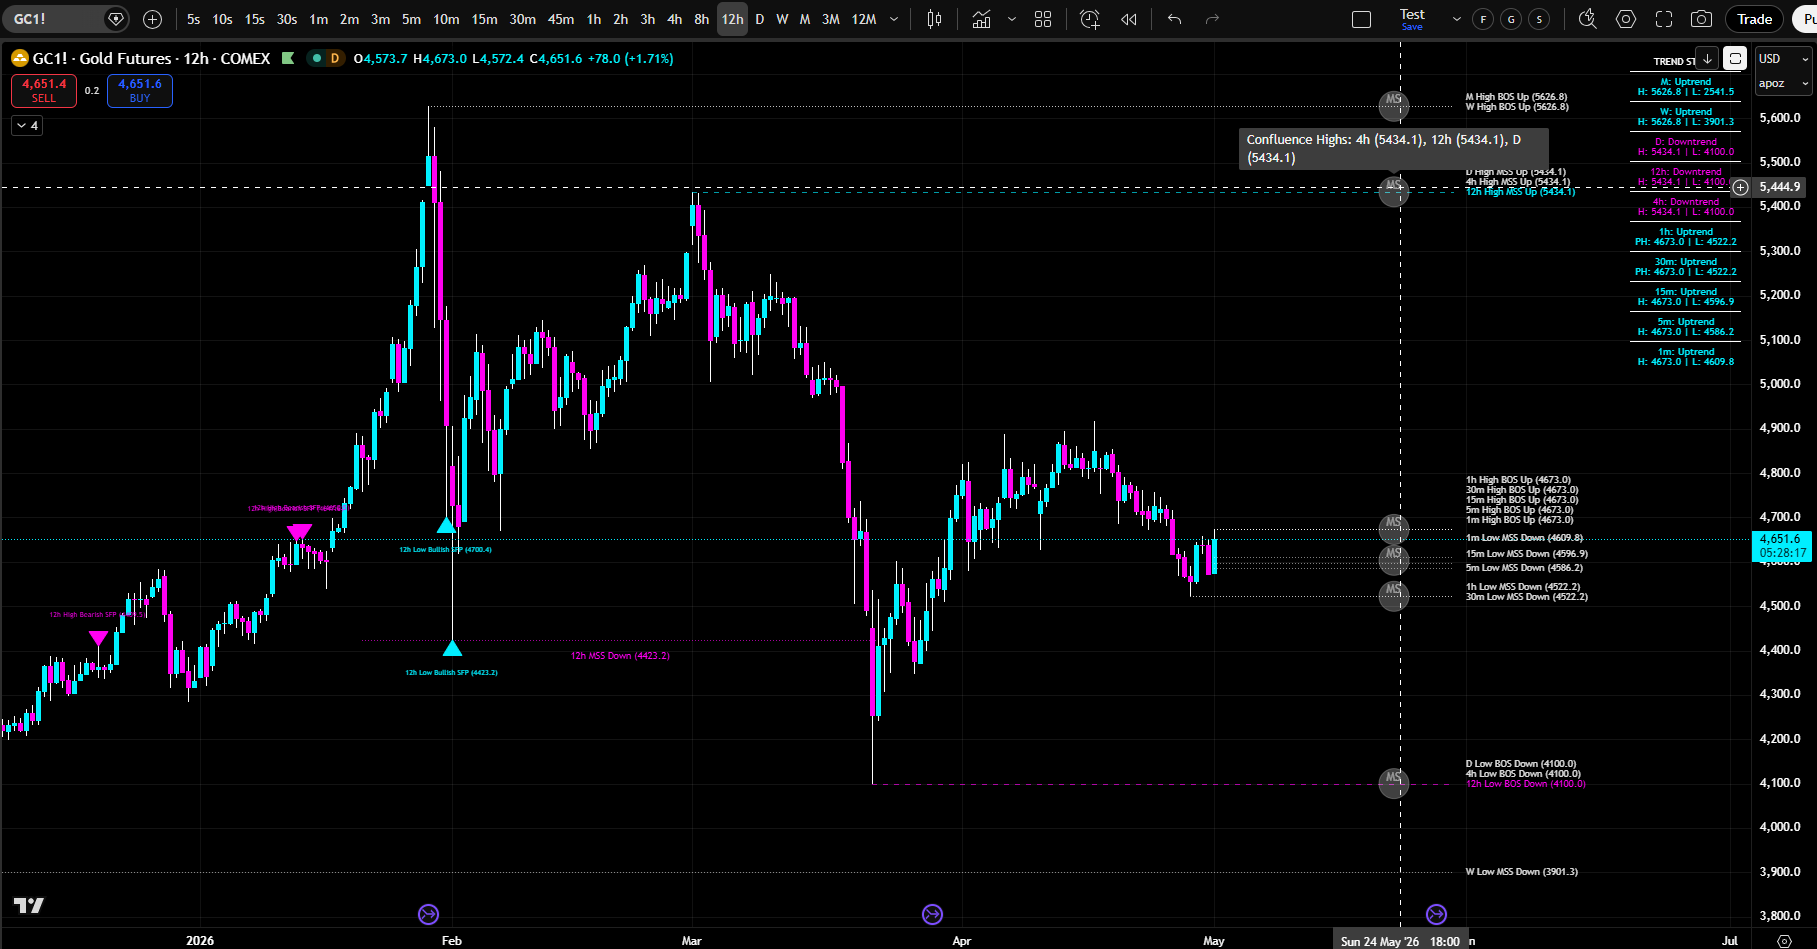
– Find confluence zones where multiple timeframes agree.
Find the exact price levels institutions are defending — and where price is being pulled.
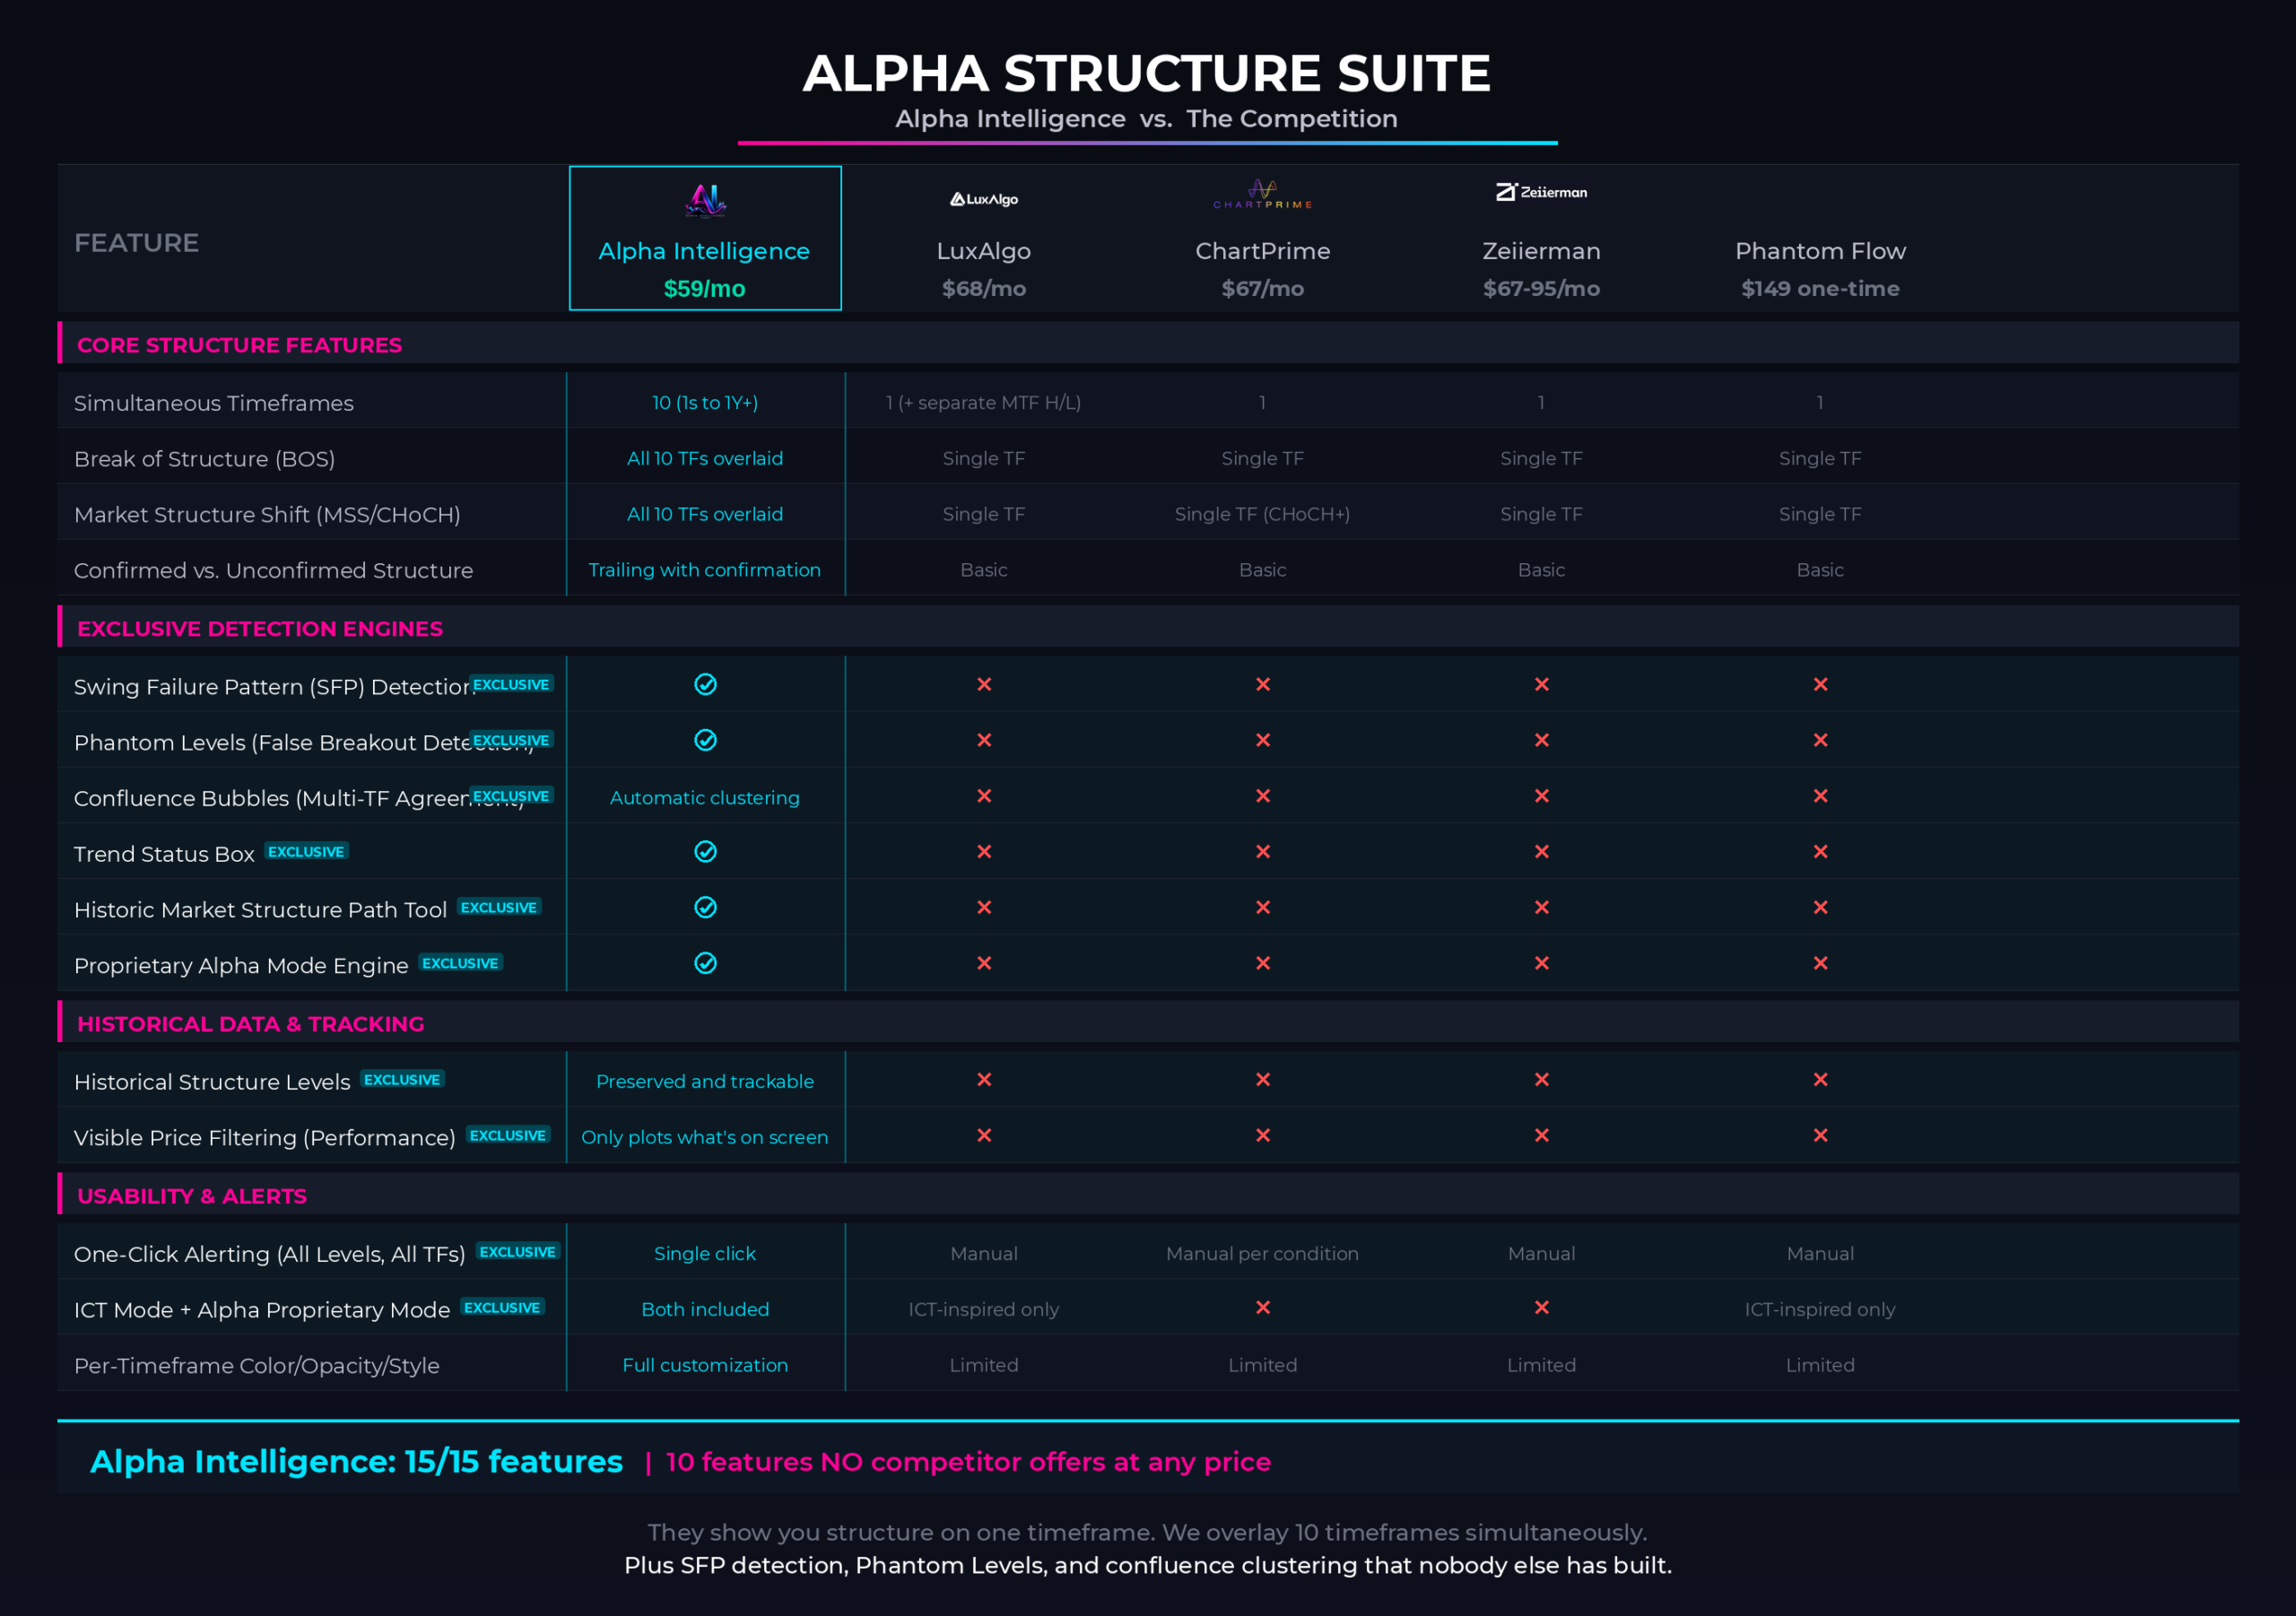
How Alpha Structure Works
Click The Image Below To Go To The “Full Product Specs Page”
How Does Alpha Structure Suite
Stack Up Against The TOP Competition?
Less than one bad trade.
Less than LuxAlgo’s single-tier plan.
Less than the cost of one month of “figuring it out yourself.”