Alpha Intelligence Indicators

Order Blocks Suite Tutorial

Learn how to use Order Blocks Suite to identify where institutional traders accumulated positions and trade high-probability order block zones.
Watch The Below Video!

Almost INSTANT TradingView access. Any chart. Any market. Cancel anytime.

Order Blocks Suite Complete Institutional Indicator Tutorial

What You Will Learn

In this tutorial, you will learn how to use Order Blocks Suite to identify exactly where institutional traders have accumulated positions at every timeframe. You will understand how to read order blocks, identify fair value gaps, recognize breaker blocks, and find confluence zones where multiple timeframes agree.

Find the exact price levels institutions are defending — and where price is being pulled.

How Order Blocks Suite Works

ORDER BLOCKS

    •  
      Professional traders use order blocks as their primary trading levels. They understand that order blocks are where institutional traders have accumulated positions.
    •  
      They know that when price approaches an order block, a reaction is likely. They trade order blocks as high-probability signals.
    •  
    •  
      Institutional traders do not place orders at random. They accumulate positions at specific price zones, and when price returns to those zones, the remaining unfilled orders create predictable reactions. 
    •  
      These zones are called order blocks — the footprints of institutional activity on your chart. An order block is the point where the big money committed.
    •  
      When the market returns to that zone, the original orders get filled, and price reacts. The stronger the original displacement, the more significant the zone.
    •  
      The Order Blocks Suite detects these zones automatically across up to 10 simultaneous timeframes using two independent detection engines — a proprietary engine for maximum precision, and a standard engine for broader coverage.
    •  
      It tracks the full lifecycle of every order block from detection through mitigation, scores each one for quality, identifies where multiple timeframes agree on the same zone, and even detects order blocks from lower timeframes while you view a higher timeframe chart.
    •  
      Fair Value Gaps, Breaker Blocks, inducement tracking, and a complete confluence system are all built in. This is how institutions trade — now you can see exactly where they are concentrated.
    •  
      If you were to plot every Order Block, Breaker Block, & FVG (on every timeframe) manually, it would take you hours to do, on just a SINGLE chart / asset.  
    •  
    • Our Suite does it in just SECONDS and can plot them FOR YOU on every chart you pull up in TradingView forevermore.

    This is how institutions see the market, and where they do business — now you can too.

FAIR VALUE GAPS

    •  
      A Fair Value Gap is the space between the order block candle and the displacement candle — the area where no trading occurred.
       
      The FVG represents an imbalance in the market. Price will often return to fill this gap before continuing in the direction of the move.
       
      Order Blocks Suite displays FVG boxes separately from order block boxes.  

      See exactly where price will likely return to fill the gap.
       
      Trade FVG fills as high-probability signals.

BREAKER BLOCKS

    •  
      A breaker block is an order block that was fully engulfed by price without being touched first.
       
      This means price moved so fast that it skipped over the order block zone entirely.

      When price later returns to a breaker block, the reaction is often stronger than a normal order block.

      Treat breaker blocks as high-priority trading levels.
       
      They represent zones where orders were not filled during the initial move, so the market is even more eager to fill them on the return.

Know exactly where institutional orders are positioned – BEFORE price gets there.

    •  
      Order Blocks Suite calculates order blocks simultaneously across seven lower timeframes plus your chart timeframe. When multiple timeframes have order blocks at the same price zone, that is institutional confluence. That is where the strongest reactions occur.
       
      Imagine seeing that the 1-minute, 3-minute, 5-minute, and 15-minute timeframes all have order blocks that overlap in the same price zone. 

      That is not just a trading level. That is a high-probability reversal zone. That is where institutional traders across multiple timeframes have accumulated positions.

      That is where price will react with force.
       
      This is what Order Blocks Suite shows you.
      This is what separates professional traders from retail traders.
    •  
      Order Blocks Suite automatically identifies confluence zones where multiple order blocks from different timeframes overlap.
       
      These are the highest-probability trading zones.

      When price approaches a confluence zone, prepare for a strong reaction.

      Confluence zones are where institutional traders across multiple timeframes are positioned.
       
      They are where the most institutional orders are waiting to be filled.

      They are where price is most likely to reverse or accelerate.

    • Dual Detection Engines
      Proprietary Engine: Alpha Mode – fewer, but higher-quality order blocks
       
      Standard Engine: catches more OBs, faster detection – potentially lower quality OBs
       
      Switch between engines anytime with a single dropdown
      Full Lifecycle Management
       
      Active → Hit → Partially Mitigated → Inducement → Historical/Mitigated
       
      Progressive mitigation percentage tracked and displayed (e.g., “Mit: 35%”)
       
      Customizable OB Kill threshold (configurable) marks the OB as fully mitigated and deletes it from your chart (stored as a historic level so you can always pull it back up in “HIT/Historical Levels”)
       
      Standard engine supports zone shrinking — the box physically reduces as price fills it.
      Proprietary Alpha Score System
       
      Quality rating (1–10) for every order block
       
      Highlight threshold (default 7) visually emphasizes only the highest-quality OBs
    •  Mirror Aggregation System
       
      Detect lower-TF order blocks while viewing a higher-TF chart
       
      For Example: See 1m, 3m, 5m OBs on a 1H chart without switching timeframes
       
      Killed-zones registry prevents “zombie” re-detection of mitigated OBs 
    • 8 Timeframes (7 Lower + Chart TF)
       
      View Order Blocks from up to 7 independent lower timeframe slots (default: 1m, 3m, 5m, 10m, 15m, 30m, 45m, 1H) in conjunction with the native timeframe you are viewing
       
      Each slot is sovereign with its own order blocks, lifecycle, and styling
      Fair Value Gap (FVG) Detection
       
      Identifies the gap between an OB candle and the displacement candle
       
      FVG boxes displayed adjacent to OB boxes with lighter opacity
       
      FVG has its own mitigation tracking (51% kill default)
       
      Configurable minimum FVG size (choose your own “size” of FVG, so you only see the FVGs you deem valid)
      Breaker Blocks
       
      Often produce stronger reactions than normal order blocks
       
      Independent enable toggle and full styling control
       
      Optionally included in confluence calculations
      Confluence Zone Detection
       
      Automatically identifies overlapping OBs from different timeframes
       
      Customizable overlap percentage so you have full control
       
      Confluence boxes displayed with higher opacity than individual OBs
       
      Breaker Blocks optionally included in clustering
       
      Configurable right offset for confluence box placement
      Hit Count, Mitigation, & Inducement Tracking
       
      Every touch of an OB zone increments the hit count, and is reflected in the OB label
       
      Every touch of an OB tracks the “mitigated percentage” and displays it on the Order Block so you never have to guess if the OB is still valid
       
      Inducement recorded in OB label (strengthens Order Block)
       
      Child Order Blocks
       
      Smaller OBs detected within larger OB zones
       
      Provide finer-resolution entry points within a broader institutional zone
       
      Configurable overlap threshold (50% default)
       
      Independent enable toggle \\\\\
    • Touch Tolerance
      3 modes: Percent (0.10% default), Ticks (3 default), ATR (adaptive to volatility)
       
      Controls how close price must come to register as a hit
      Label Content Control
       
      Independently toggle: timeframe, direction (Bull/Bear), engine type, alpha score, volume, hit count, mitigation %, inducement count, child count, BOS/MSS alignment, trend alignment
       
      Show exactly the information you need — nothing more
      Historical Order Block Display
       
      Turn Historical Levels on to see EXACTLY how price reacted in the past when it reached an Order Block (on any timeframe). Use for back-testing and data driven insights
       
      Mitigated OBs displayed in cyan (bullish) or pink (bearish)
       
      Fixed right edge at the bar where mitigation occurred
       
      Per-timeframe historical toggles
      Alert Engine
       
      OB Detected — new order block identified
       
      OB Hit — price touches an OB zone
       
      OB Mitigated — OB fully filled past kill threshold
       
      Confluence Formed — new confluence zone detected
       
      Configurable cooldown to suppress duplicate alerts
       
      Customizable alert prefix
       
      Now, at the click of a button, you can save HOURS of “manual alert setting” by simply letting the Order Blocks Suite alert engine set your alerts for you in SECONDS
      Displacement Settings
       
      Multiplier mode: You choose how large the displacement candle must be to “qualify” the Order Block (or just use the default “Alpha” settings)
       
      Styling & Customization
       
      Active OB: fill color, fill opacity, border color, border opacity, border width, border style
       
      FVG boxes: independent fill, border, and text styling
       
      Breaker Blocks: independent fill, border, and text styling
       
      Historical OBs: independent bullish/bearish colors, opacity, border style
       
      Confluence boxes: independent fill, border, text styling with higher opacity
       
      Text size options: Tiny, Small, Normal, Large, Huge
       
      Text alignment: horizontal (Left, Center, Right) and vertical (Top, Center, Bottom)
      Performance & Optimization
       
      Visible price filter prevents drawing OBs far off-screen
     
    • How Order Blocks Suite Works
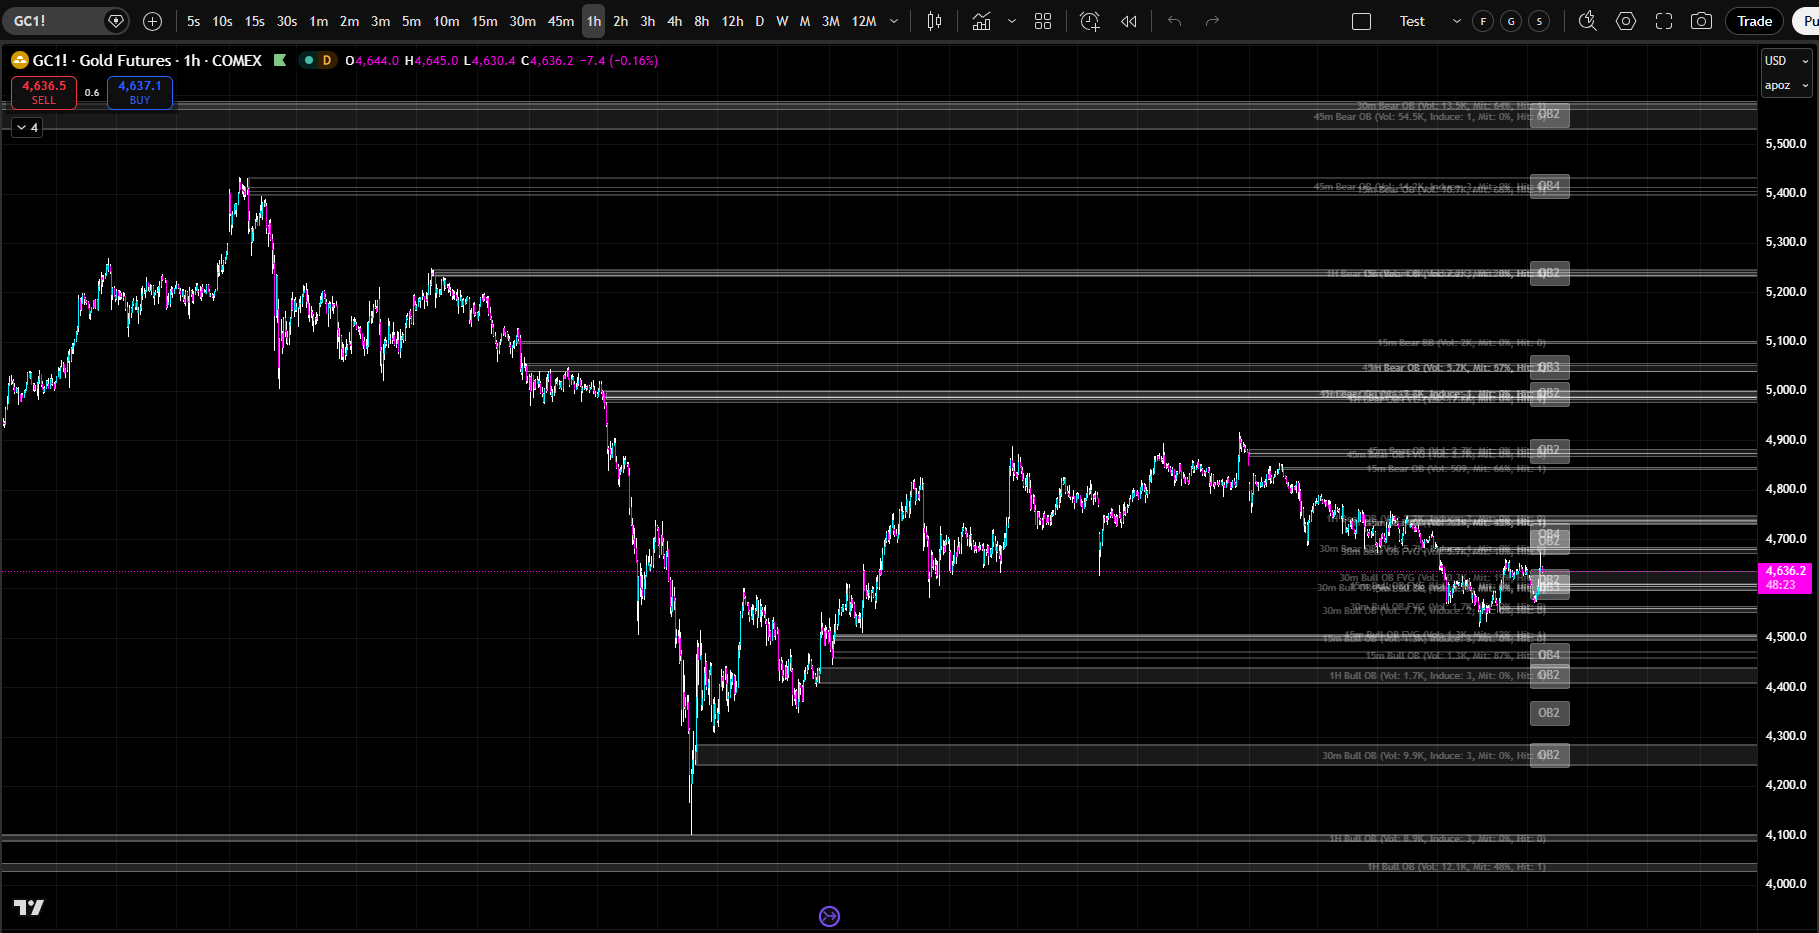
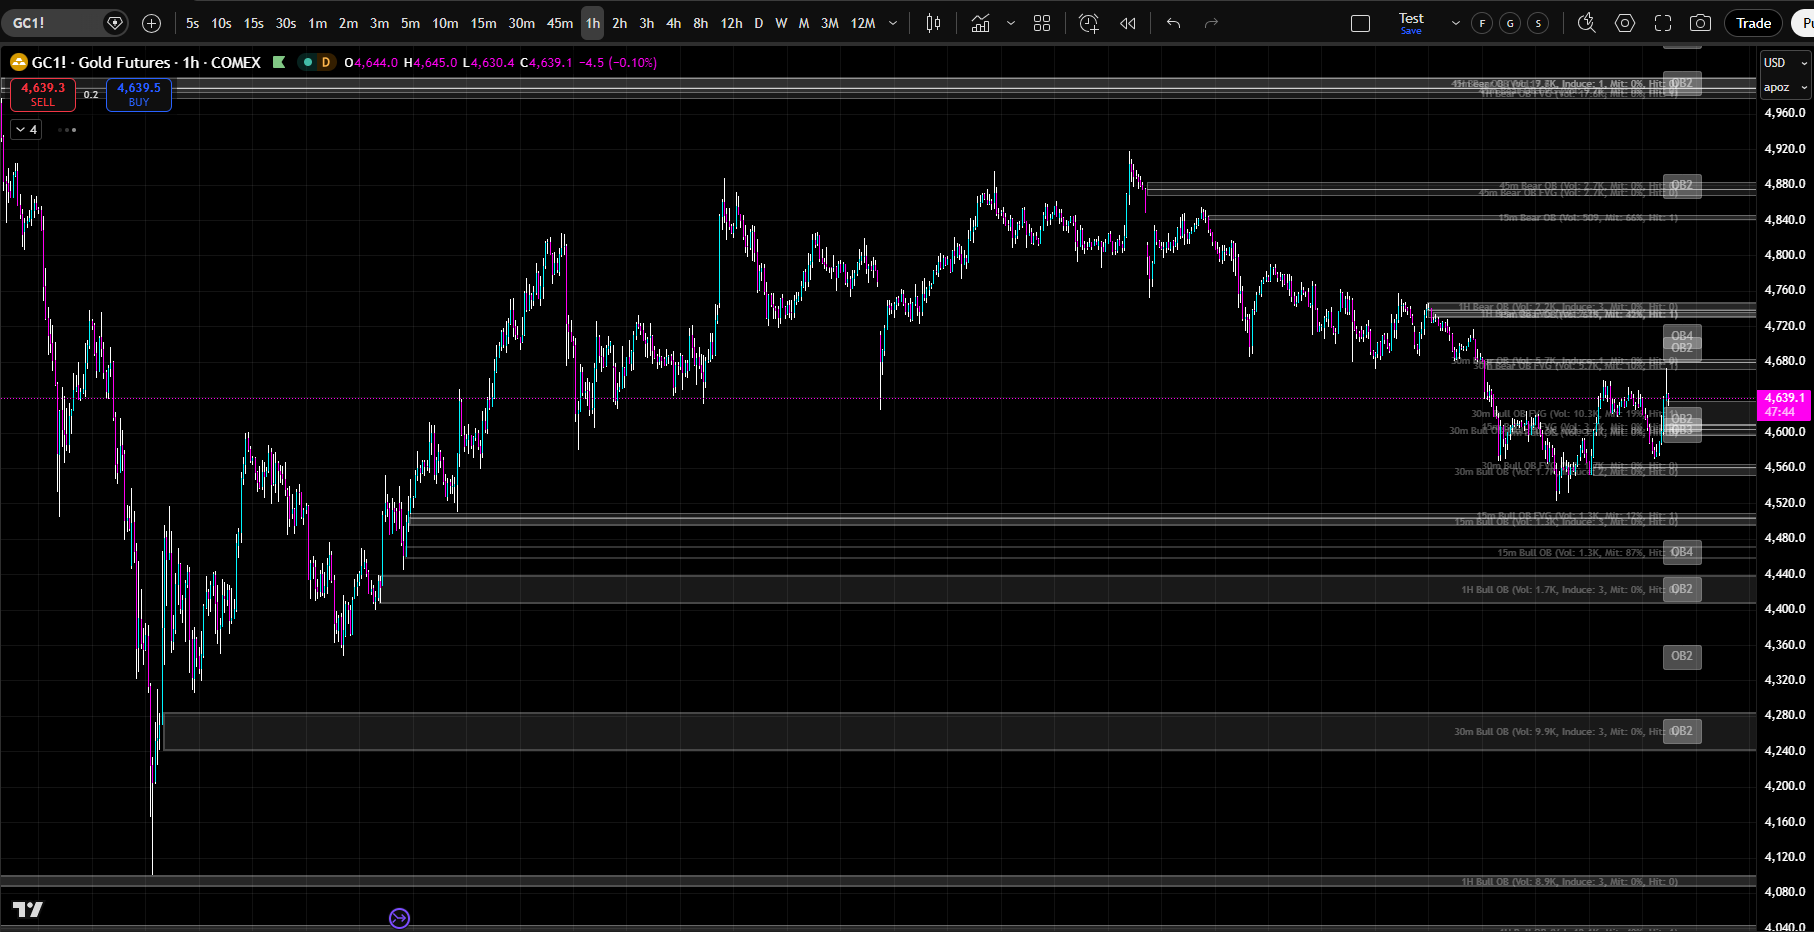
      Order Blocks Suite identifies institutional order blocks across up to nine simultaneous lower timeframes plus your chart’s native timeframe.
      An order block is a zone where institutional traders have accumulated positions. When price returns to an order block, the original orders are still there, waiting to be filled. This creates predictable price behavior.
      The indicator uses two detection engines. The Proprietary engine uses a three-candle pattern with a Fair Value Gap requirement. It is more conservative and more precise. The Standard engine uses a simpler two-candle pattern. It is faster and catches more order blocks.

      Key Features Explained
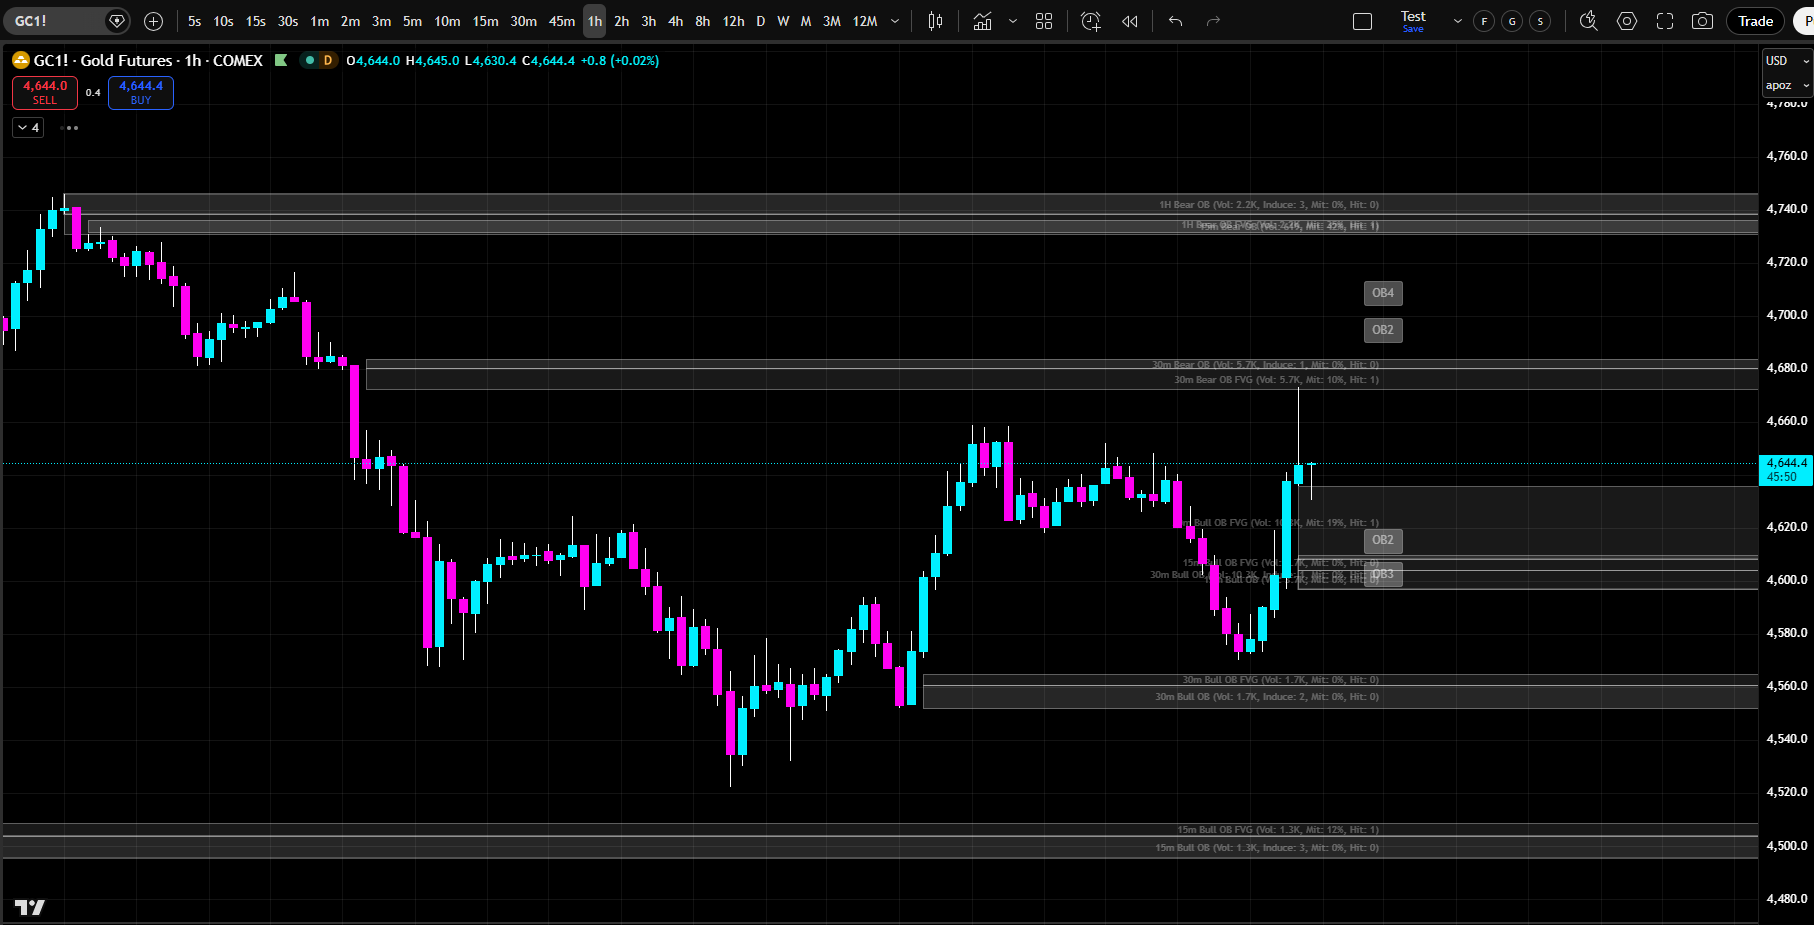
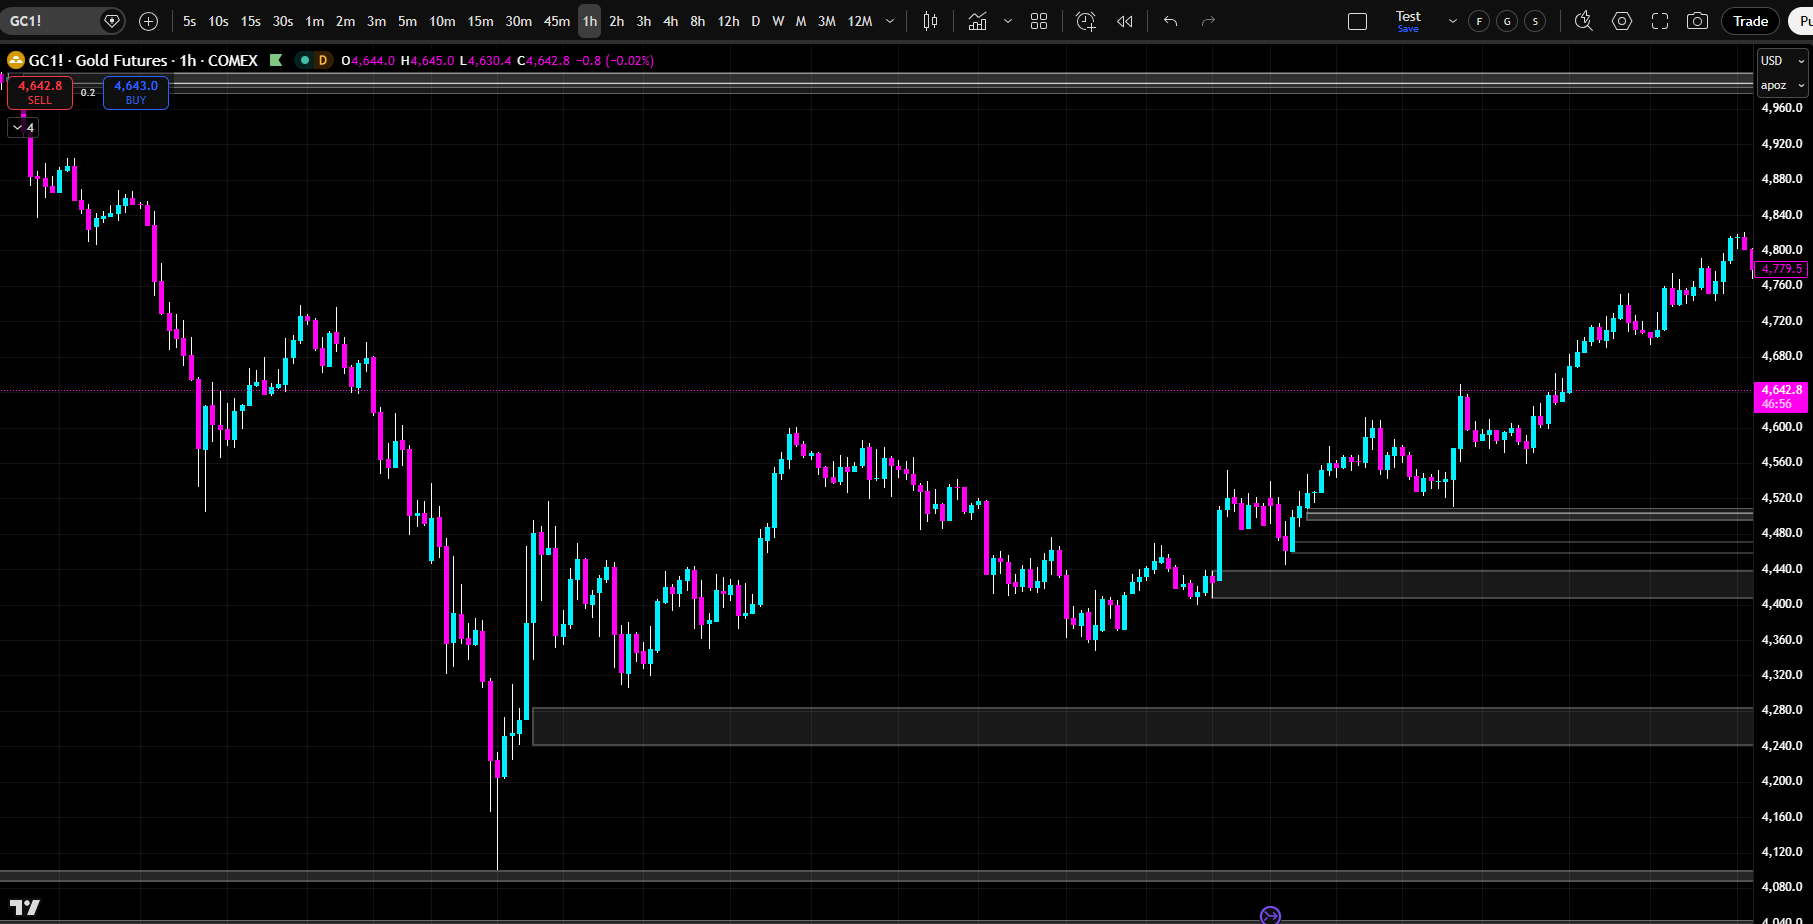
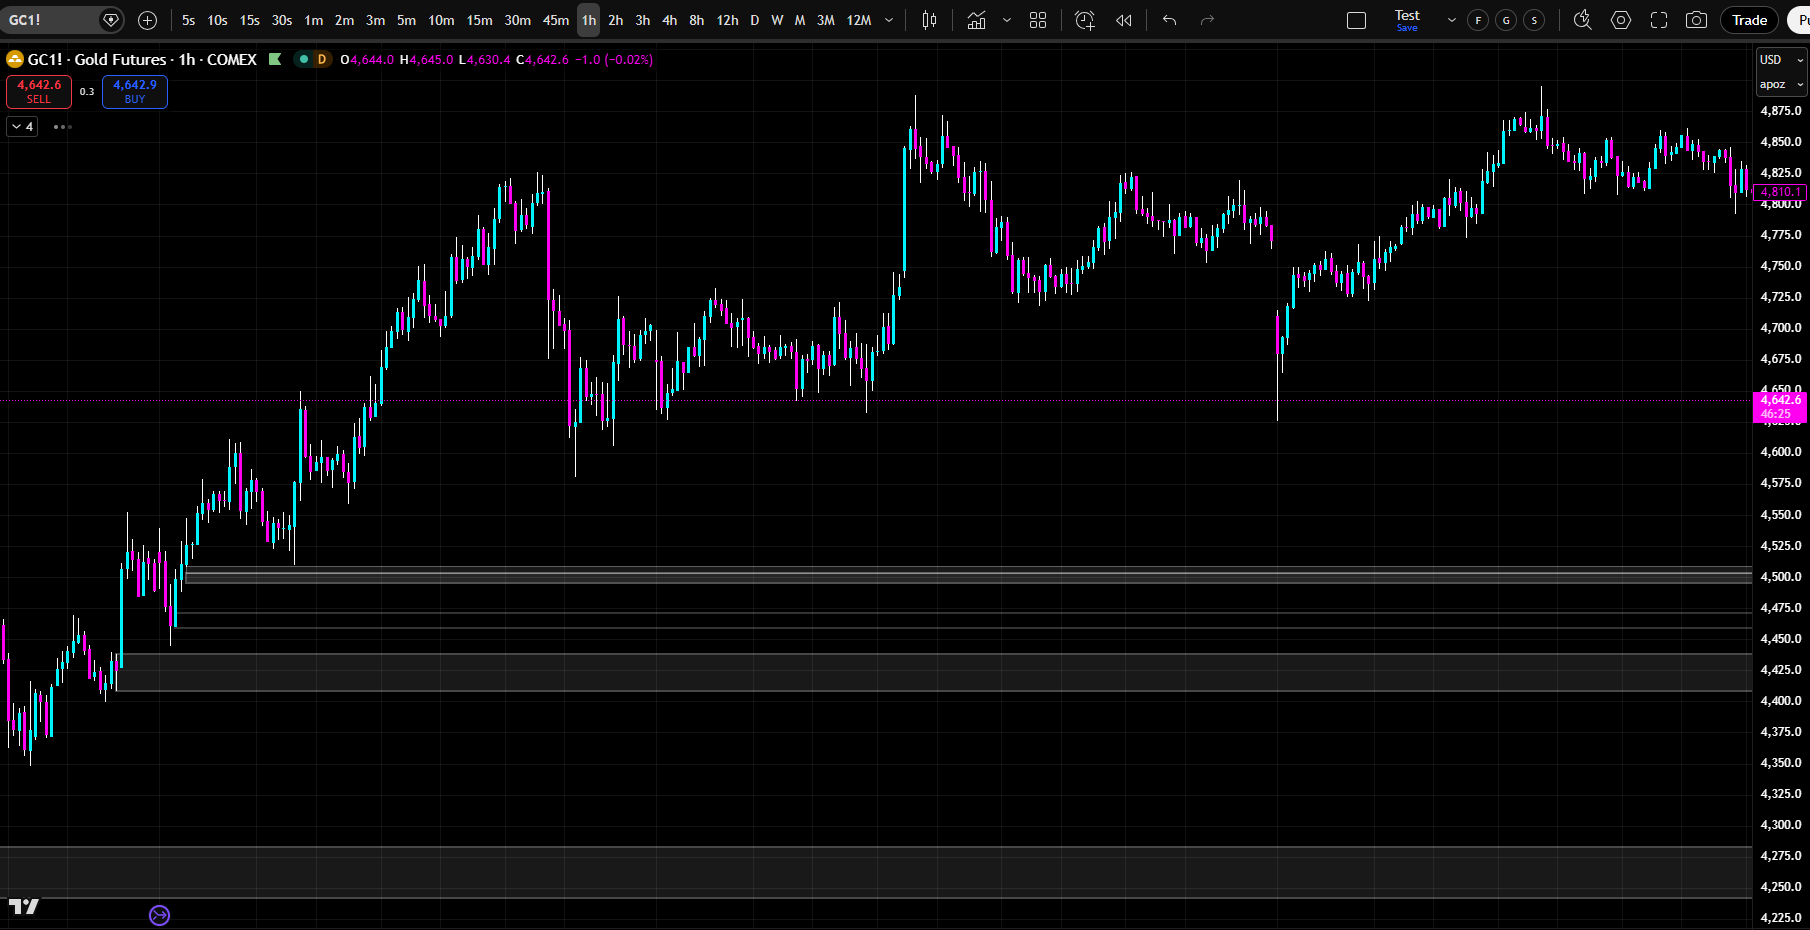
      The indicator displays active order blocks as white boxes extending to the right. These are zones where institutional traders have accumulated positions and are waiting to be filled. Each box is independently customizable — choose colors, opacity, thickness, and style.
      The indicator displays Fair Value Gaps as smaller boxes adjacent to order blocks. The FVG is the gap between the order block candle and the current candle — the area where no trading occurred. Price will often return to fill this gap before continuing in the direction of the move.
      The indicator displays historical order blocks as cyan (bullish) or pink (bearish) boxes with dashed borders. These are zones where price has already been filled. They show where institutional traders have already accumulated and distributed.
      The indicator identifies breaker blocks — order blocks that were fully engulfed without being touched first. When price returns to a breaker block, the reaction is often stronger than a normal order block. Treat breaker blocks as high-priority trading zones.
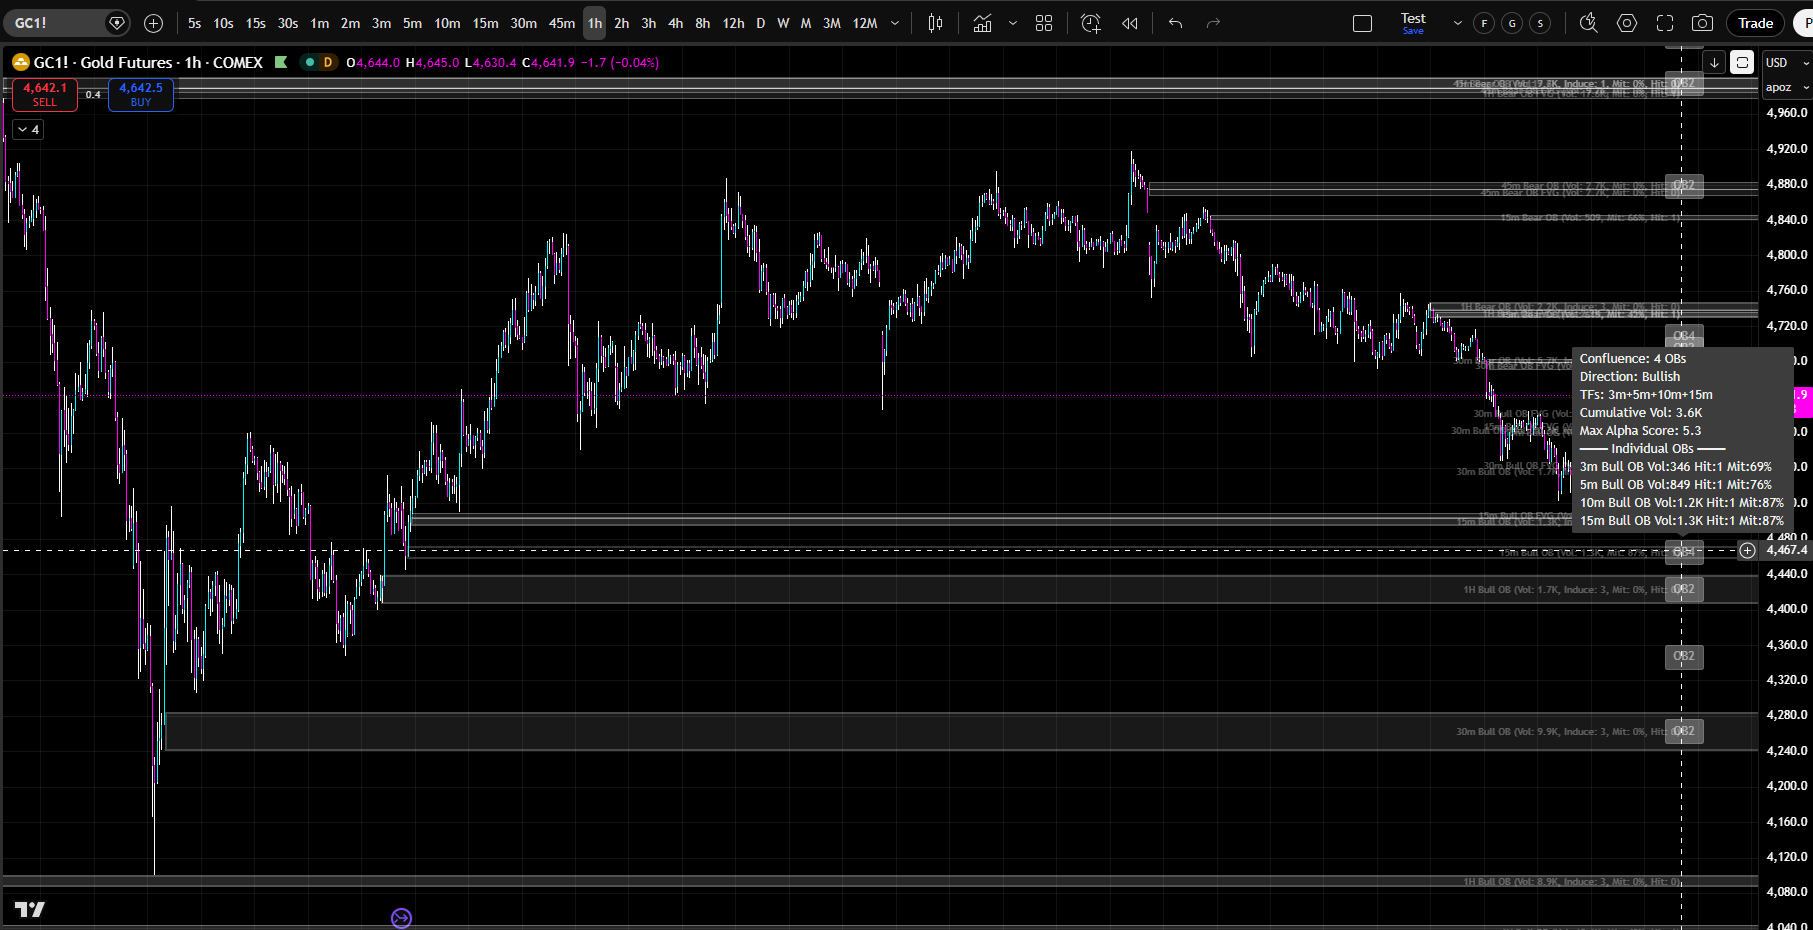
      The indicator calculates an alpha score for each order block based on hit count, inducement count, proximity to price, timeframe weight, and confluence. Higher scores indicate higher-probability order blocks. Prioritize order blocks with scores 8 and above.
      The indicator identifies confluence zones where multiple order blocks from different timeframes overlap. These are the highest-probability trading zones. When price approaches a confluence zone, prepare for a strong reaction.
      The indicator tracks hit count and inducements. Each time price touches an order block zone, the hit count increases. When price touches, bounces away, and touches again, an inducement is recorded. Multiple hits and inducements suggest the market is interested in that zone.

      How to Use It
      Start by enabling the timeframes that match your trading style. Scalpers might use 1m, 3m, 5m, 10m, 15m, 30m, 45m, 1H. Day traders might use 5m, 15m, 30m, 1H, 4H. Swing traders might use 1H, 4H, D, W.
      Look for confluence zones where multiple order blocks from different timeframes overlap. These are high-probability trading zones. When price approaches a confluence zone, prepare for a strong reaction.
      Identify order blocks with high alpha scores (8+). These are the highest-quality zones. Prioritize them over lower-scoring order blocks.
      Watch for order blocks with multiple hits and inducements. The market has already tested these zones multiple times. They are likely to react strongly on the next touch.
      Use order blocks as your entry and exit levels. Enter in the direction of the order block when price approaches the zone. Exit at order blocks on the opposite side. Place stop losses beyond order block zones.
      Identify breaker blocks. When price returns to a breaker block, prepare for a strong reaction. Breaker blocks are often the highest-probability trading levels.
      Use the mirror aggregation system to see lower timeframe order blocks while viewing a higher timeframe chart. Get a complete multi-timeframe picture without switching charts.

      Customization
      Every order block box, label, and element is independently customizable. Choose any color, any opacity, any line thickness, any line style.
      Hide boxes for specific timeframes to reduce clutter while keeping them active for confluence. Build the exact trading interface you want.

      Real-Time Alerts
      Enable real-time alerts to be notified when order blocks are detected, when price hits an order block, when order blocks are mitigated, when confluence zones form. Never miss a trading opportunity.

      Next Steps
      Load Order Blocks Suite on your chart. Enable the timeframes that match your trading style. Practice identifying confluence zones. Watch for order blocks with high alpha scores. Look for order blocks with multiple hits and inducements. Use order blocks as your entry and exit levels. Start trading with institutional precision.

Click The Image Below To Go To The “Full Product Specs Page”

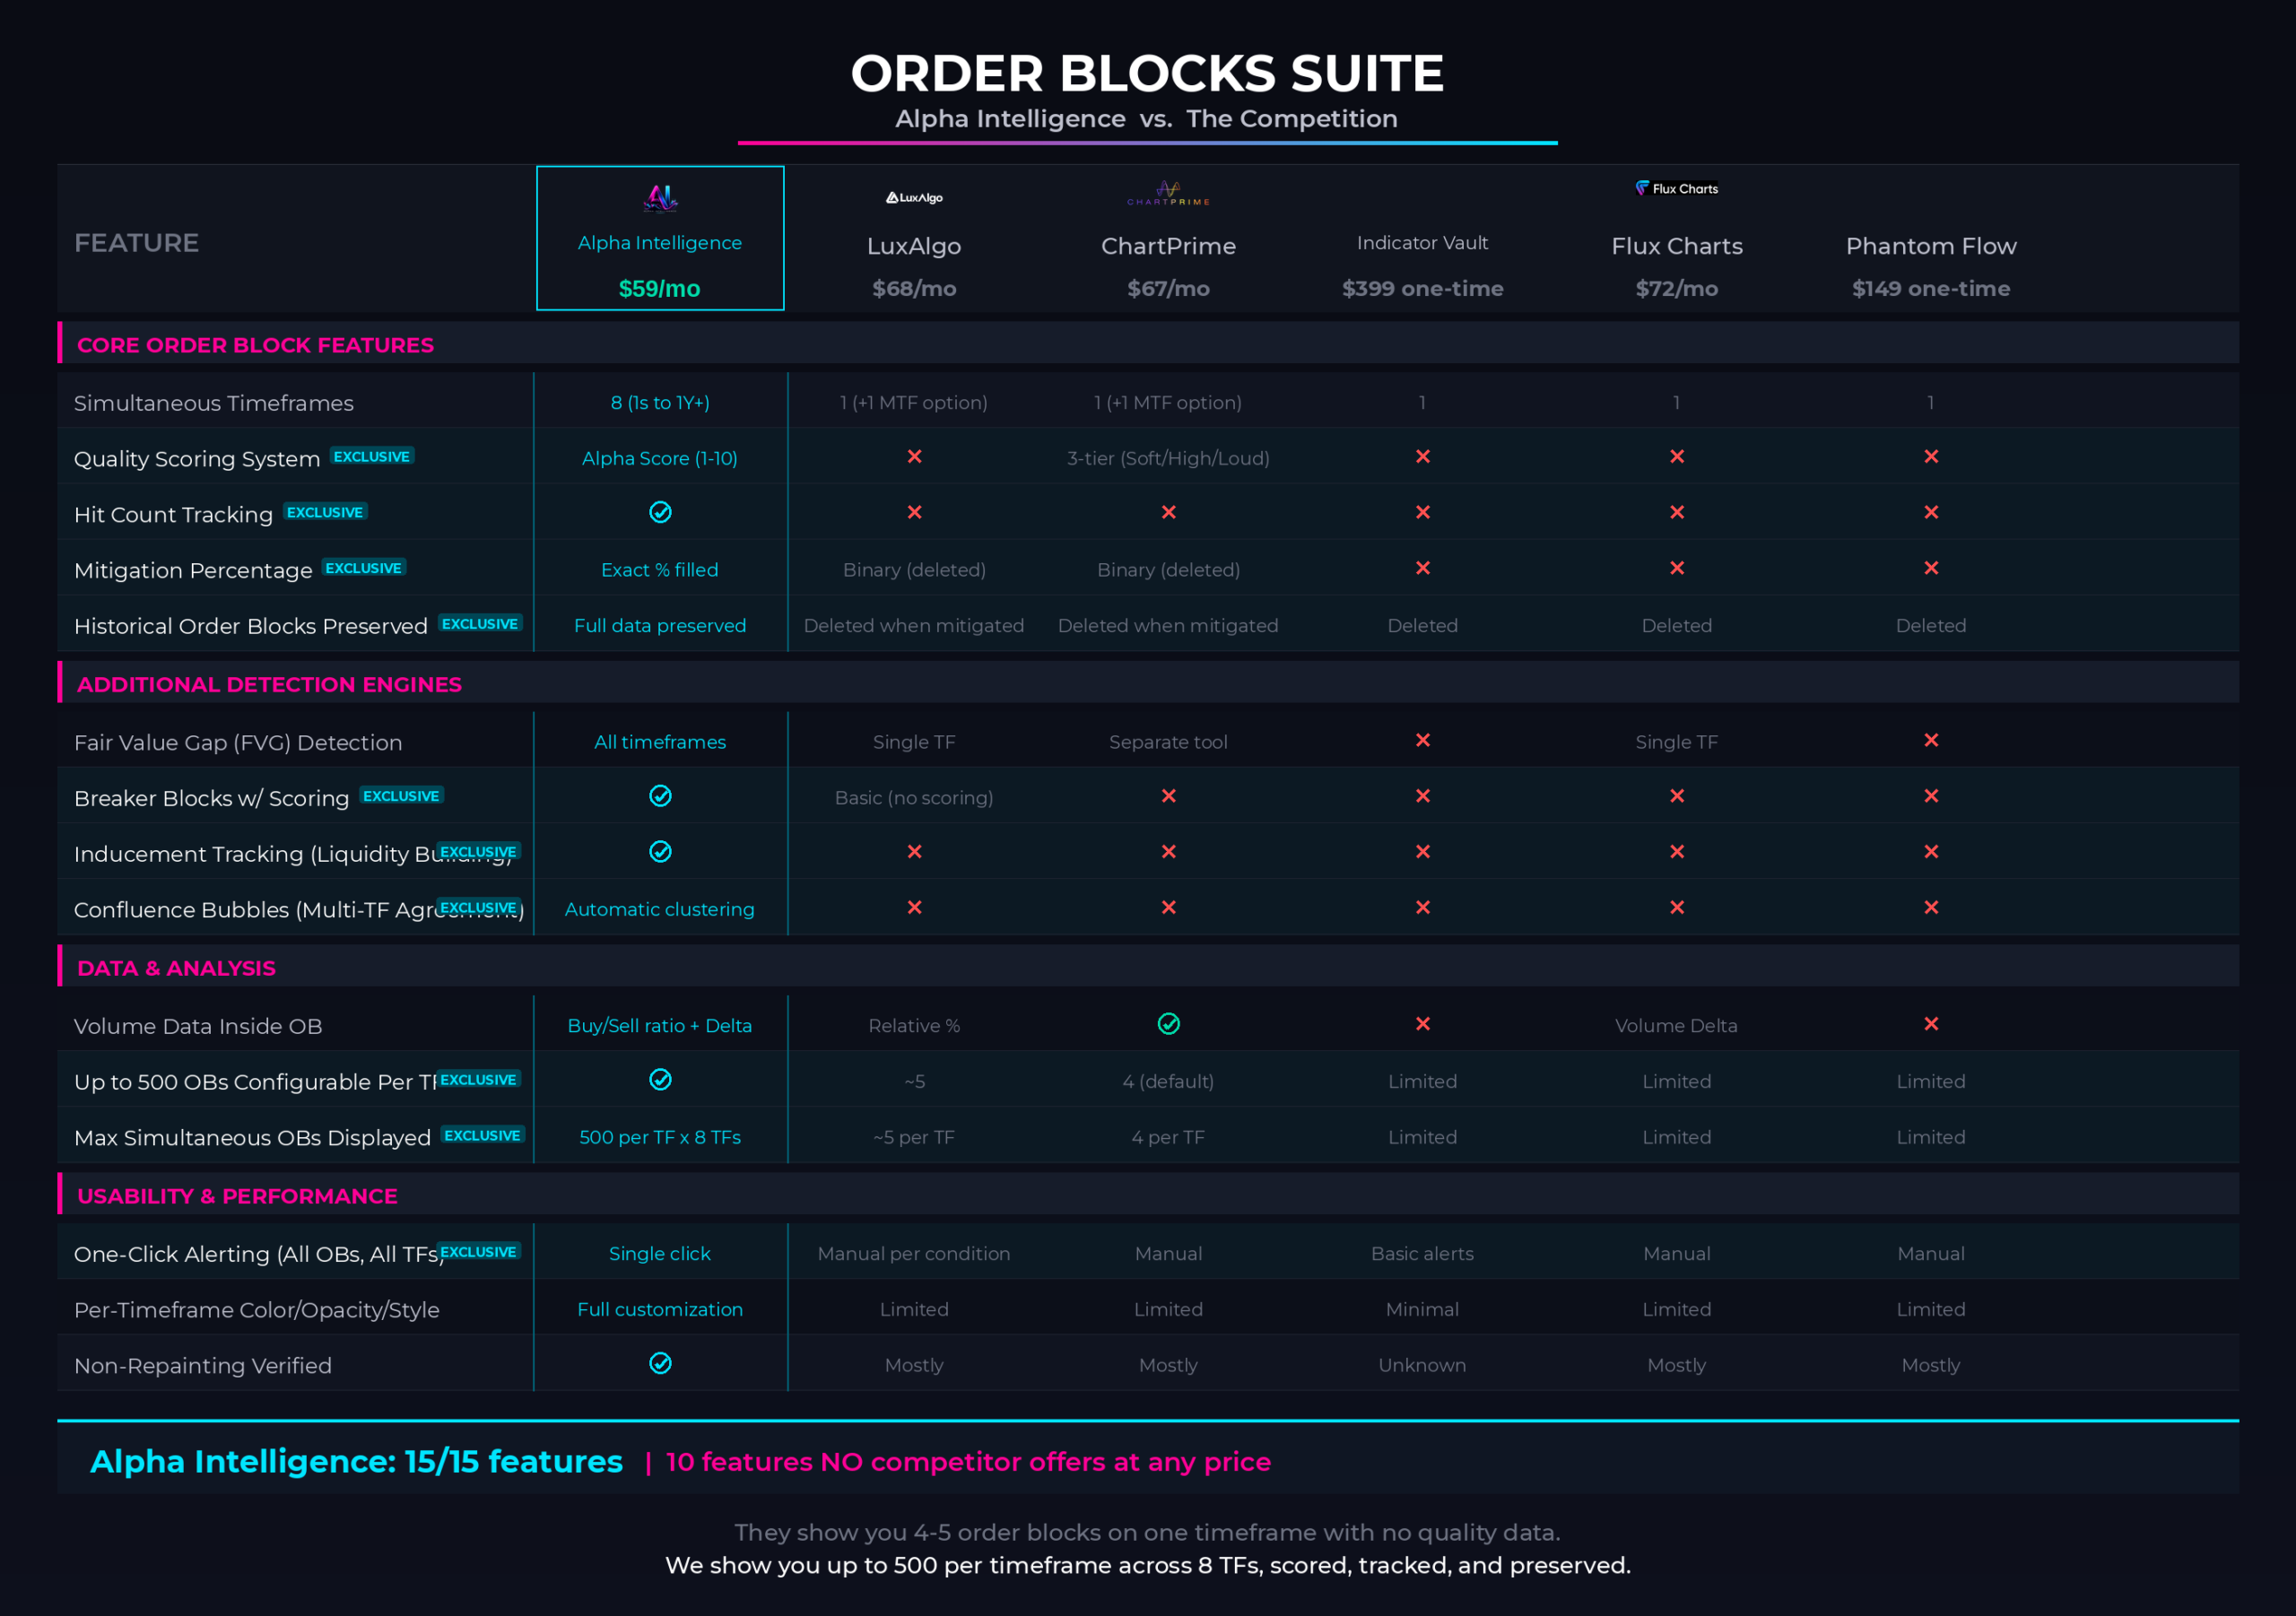
THE COMPETITION DOESN'T COMPARE... AND IT IS NOT EVEN CLOSE

How Does Order Blocks Suite
Stack Up Against The TOP Competition?

Order Blocks Suite offers features that no other indicator on the market offers, and significantly outperforms anything available to date. Here is how… 
*Click on the image below to zoom in.*

  • There is not a SINGLE indicator in the market that actually offers the “Multi-Timeframe Naked Institutional Order Block Levels”. Every wondered… WHY? 
  • Consistently outperforms LuxAlgo’s Order Block Indicators. 
  • Consistently outperforms ChartPrime’s Built-In Order Block Indicators.
  • Consistently outperforms Indicator Vault’s Order Block Indicators.
  • Consistently outperforms Flux Charts’ Free Library of VWAP Indicators.
  • Consistently outperforms Phantom Flow’s Free Library of VWAP Indicators.
  • And it has 10 features that no other indicator in the ENTIRE indicator’s market offers.
  •  
GET STARTED TODAY

One Plan. Everything Included. Any Market.

$49 / month

Everything. Every indicator. Every market. Every timeframe. One price.

  • The complete Alpha Intelligence indicator suite — every tool, fully unlocked.
  • Almost INSTANT TradingView access. Any chart. Any market. Cancel anytime.
  • Any market — stocks, crypto, forex, futures, commodities.
  • Any timeframe — from 1-minute scalps to monthly swing trades.
  • Full customization — colors, timeframes, alerts, labels, modes. Make it yours.
  • Real-time alerts on every indicator — across every level, every session, every timeframe. One click.
  • Tutorial videos for every indicator — so you are never lost.
  • Ongoing updates, new features, and new indicators as they are released.

Cancel anytime. No contracts. No hidden fees. Almost INSTANT TradingView access. Any chart. Any market. Cancel anytime.

Scroll to Top