Learn how to use Naked POC Suite to find where institutional traders spent the most time and trade high-probability POC zones.
Watch The Below Video!
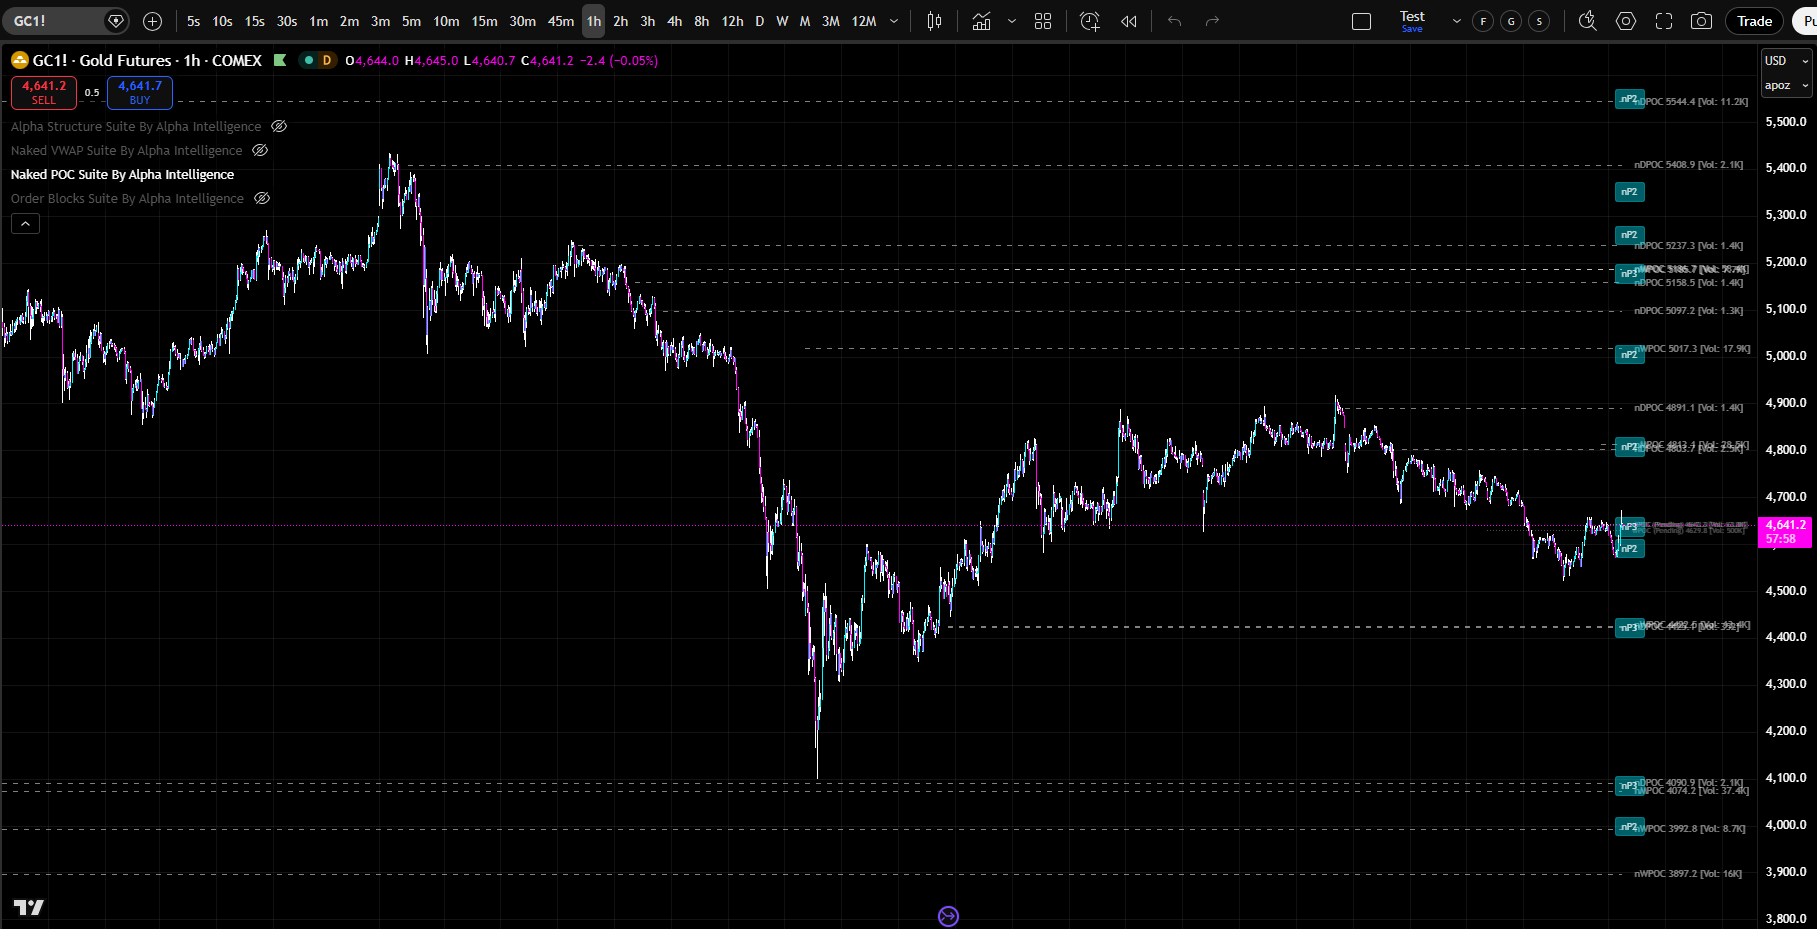
In this tutorial, you will learn how to use Naked POC Suite to identify exactly where institutional traders spent the most time at every timeframe:
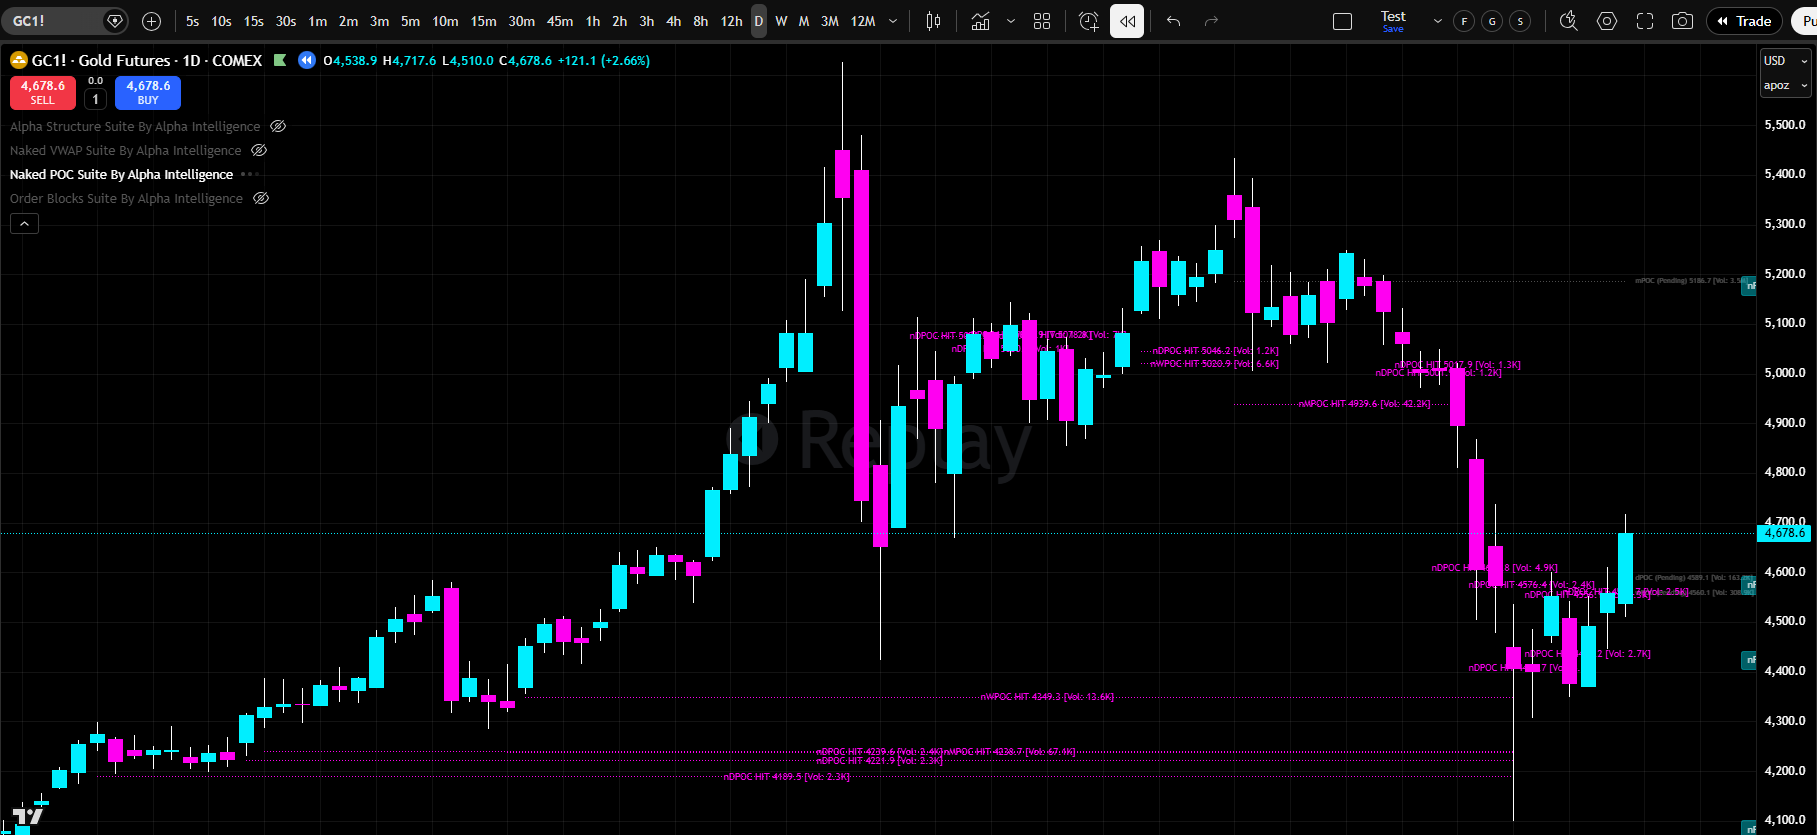
– You will understand how to read Point of Control levels
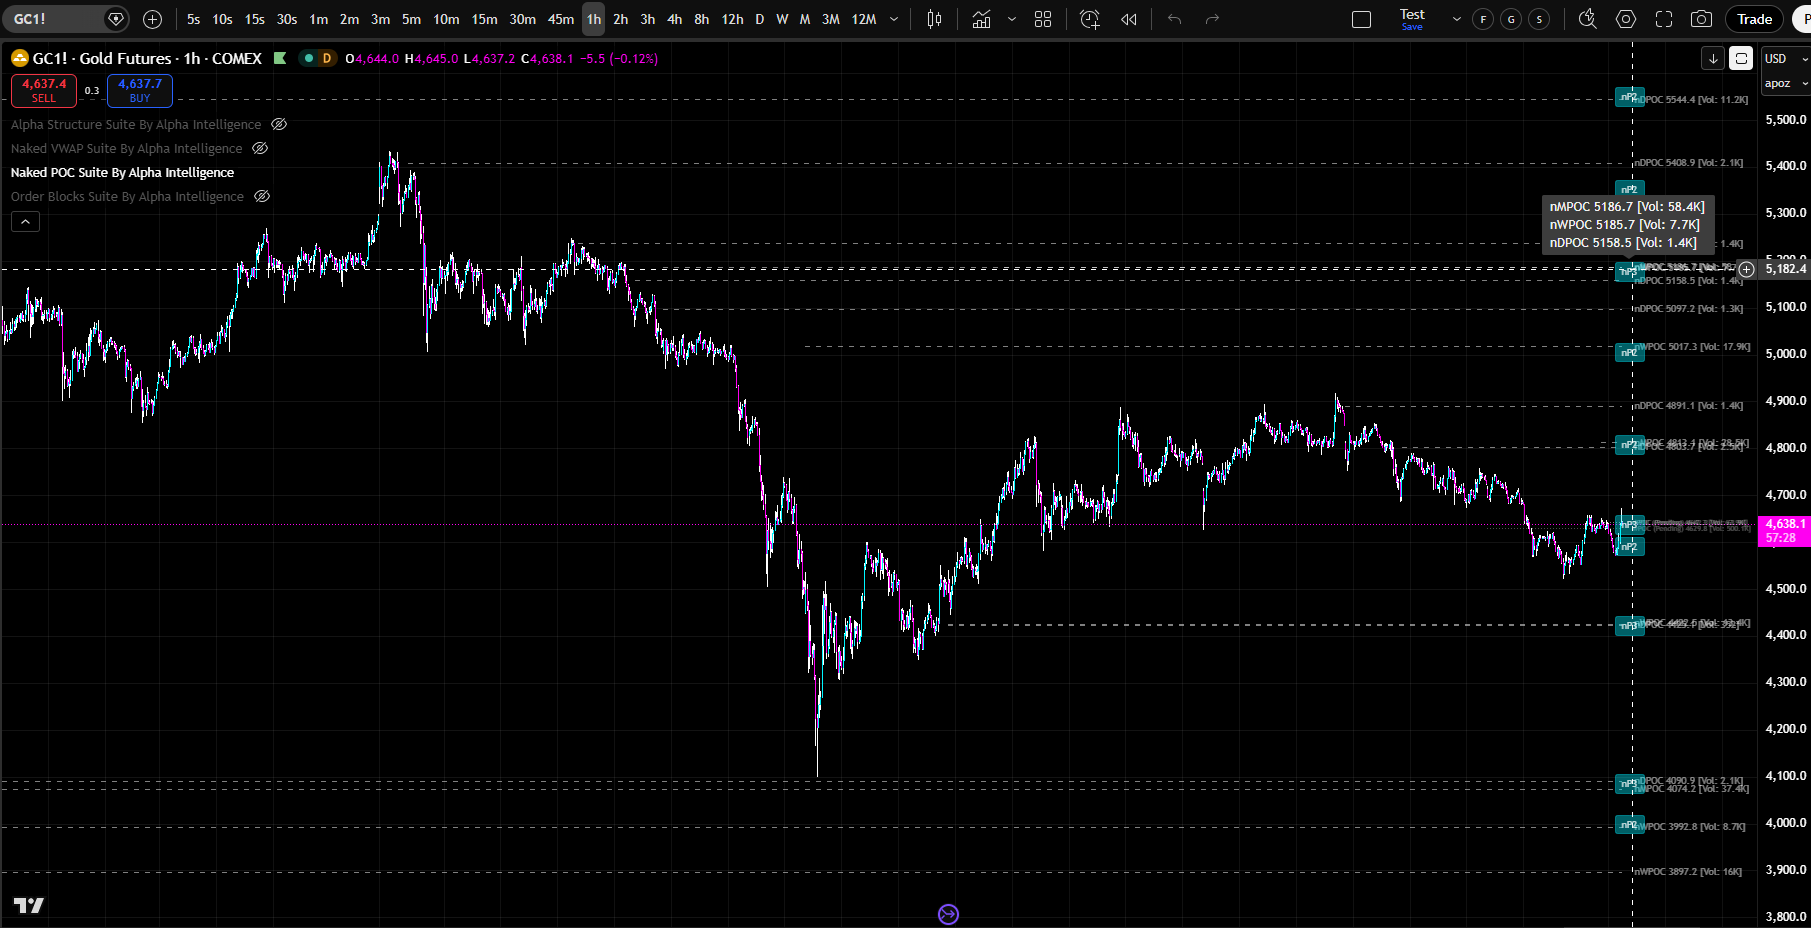
– Identify Naked POC levels as a magnet for price
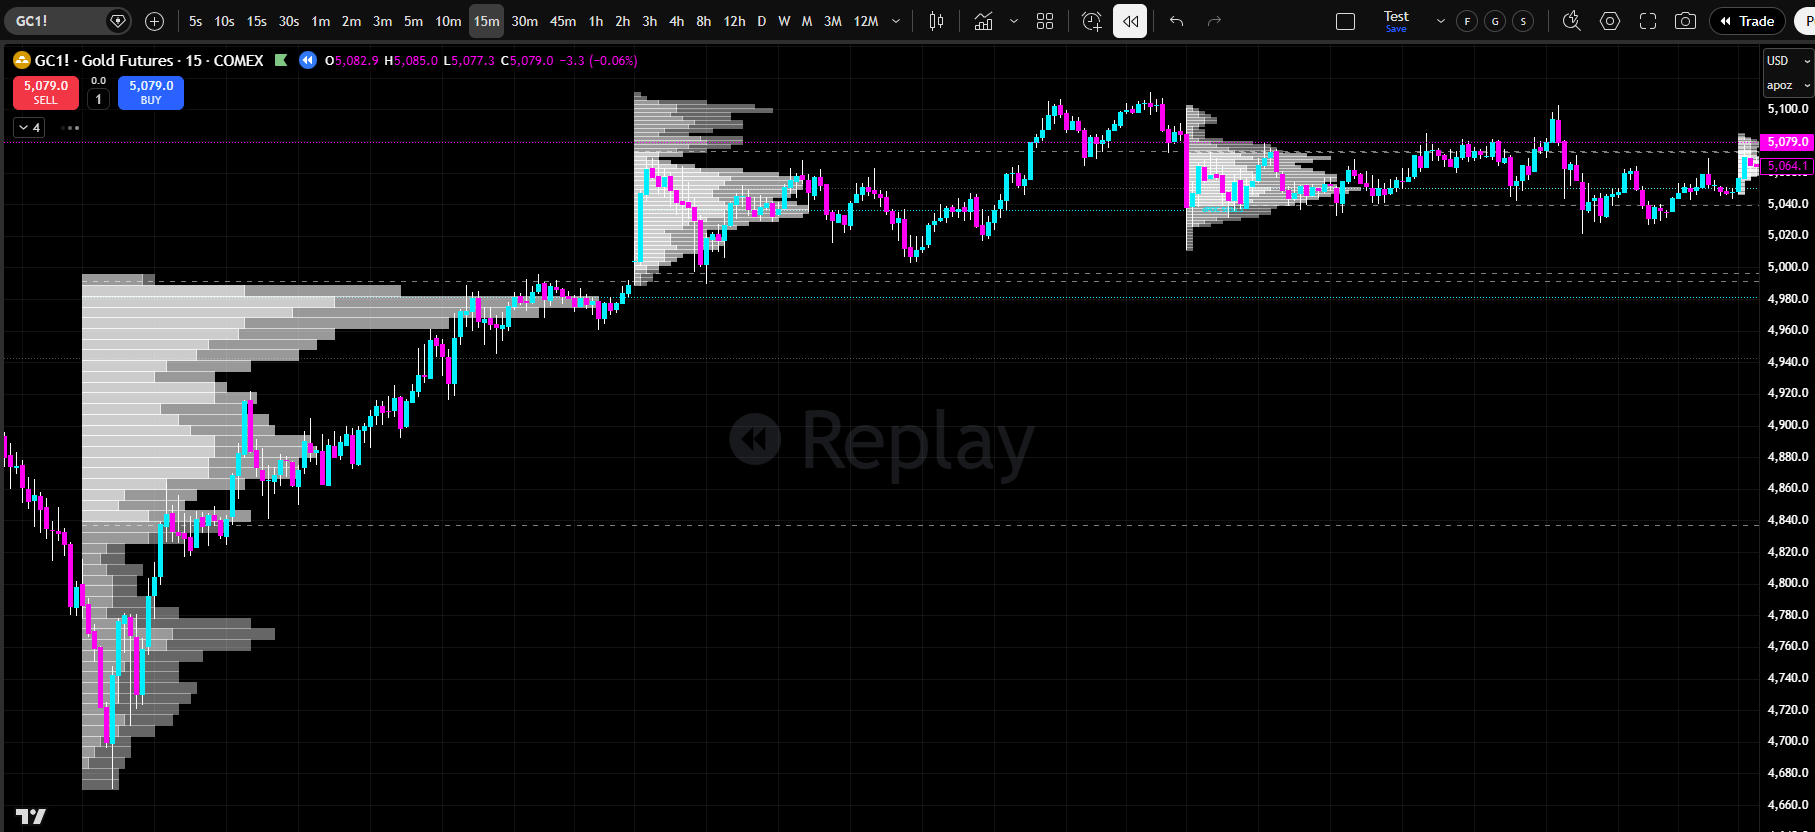
– Add Multi-Timeframe Volume Profiles to your chart
– Find confluence zones where multiple timeframes agree on a price level.
Find the exact price levels institutions are defending — and where price is being pulled.
Click The Image Below To Go To The “Full Product Specs Page”
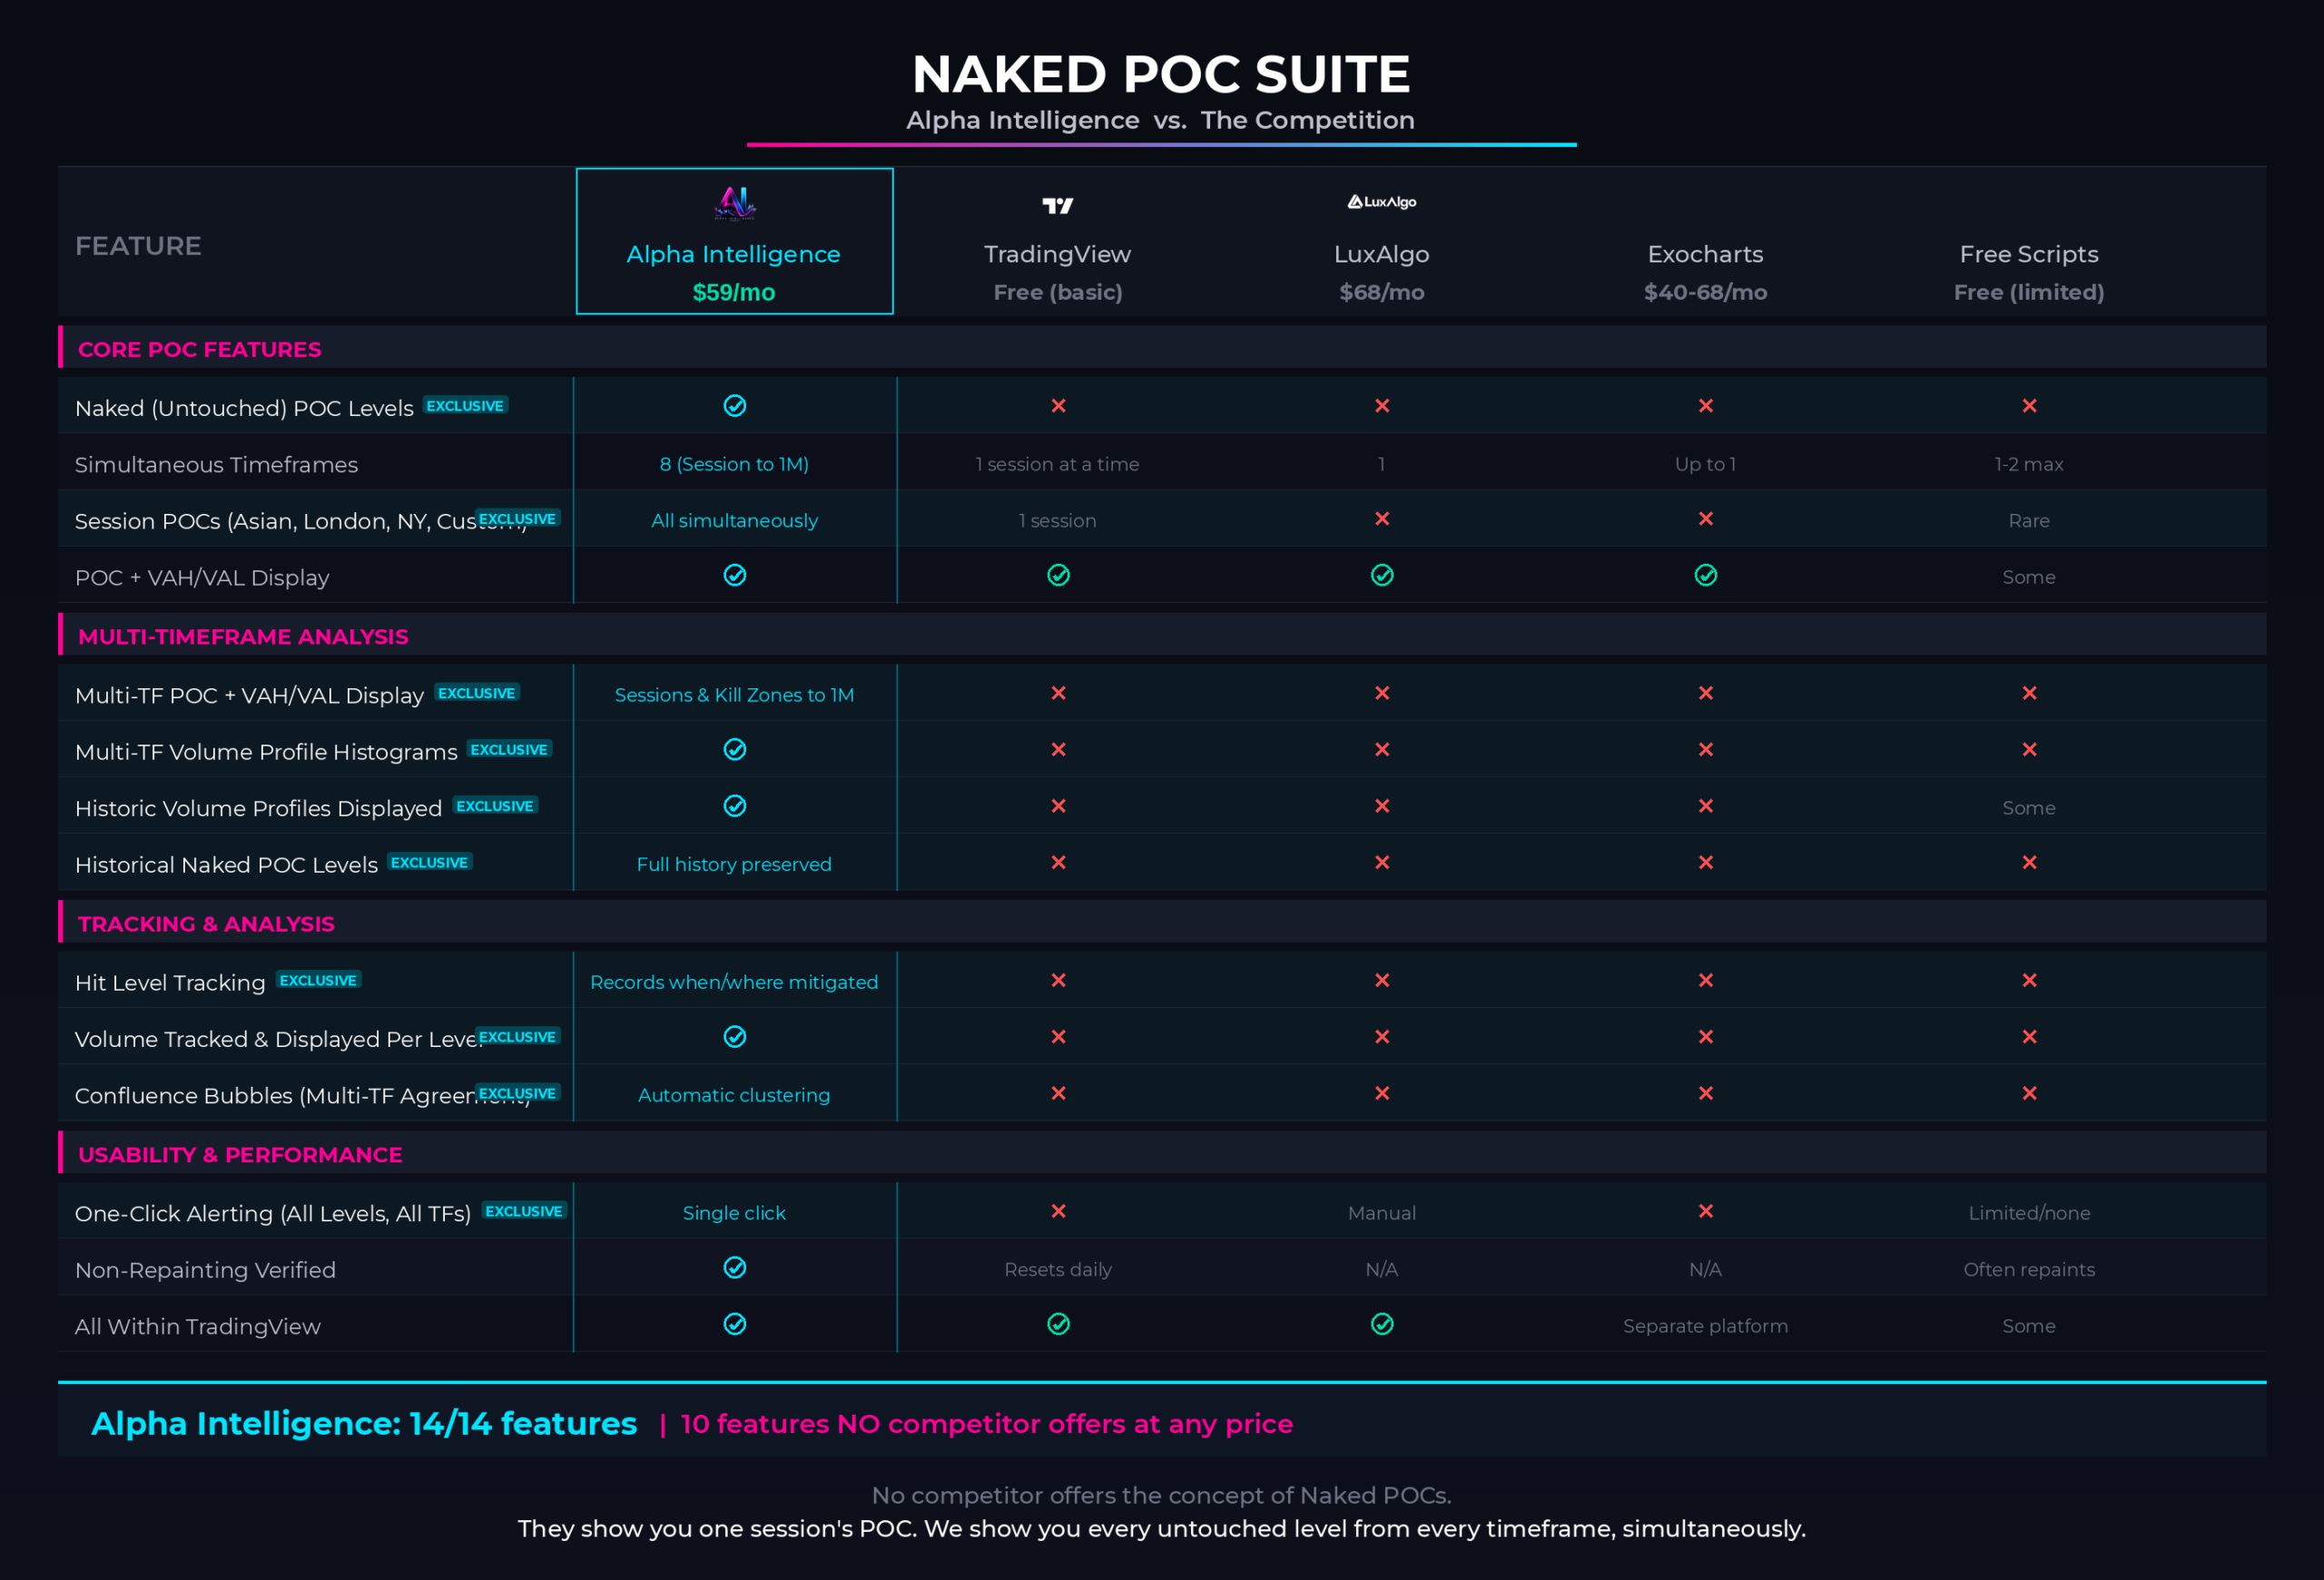
How Does Naked POC Suite
Stack Up Against The TOP Competition?
Less than one bad trade.
Less than LuxAlgo’s single-tier plan.
Less than the cost of one month of “figuring it out yourself.”