
Alpha Structure Suite
10 timeframes of market structure. One chart. Zero manual work.
Watch The Below Video!
Most traders chase price.
Structure traders know where price is going before it gets there.
This suite shows you the structure on every timeframe — simultaneously — so you stop chasing and start leading.
Almost INSTANT TradingView access. Any chart. Any market. Cancel anytime.

Market structure is the only thing that matters.
Direction. Reversals. Trend shifts. It’s all in the structure.
The problem isn’t that traders don’t understand it.
The problem is that reading structure on 10 timeframes — manually — is a full-time job.
So traders pick one timeframe and hope.
They miss the reversal that was obvious on the 4H.
They get stopped out by a structure shift they never saw coming on the daily.
Alpha Structure Suite puts all 10 timeframes on one chart.
In real time. Automatically.
Now you see what the market is doing at every level — before you place a single trade.
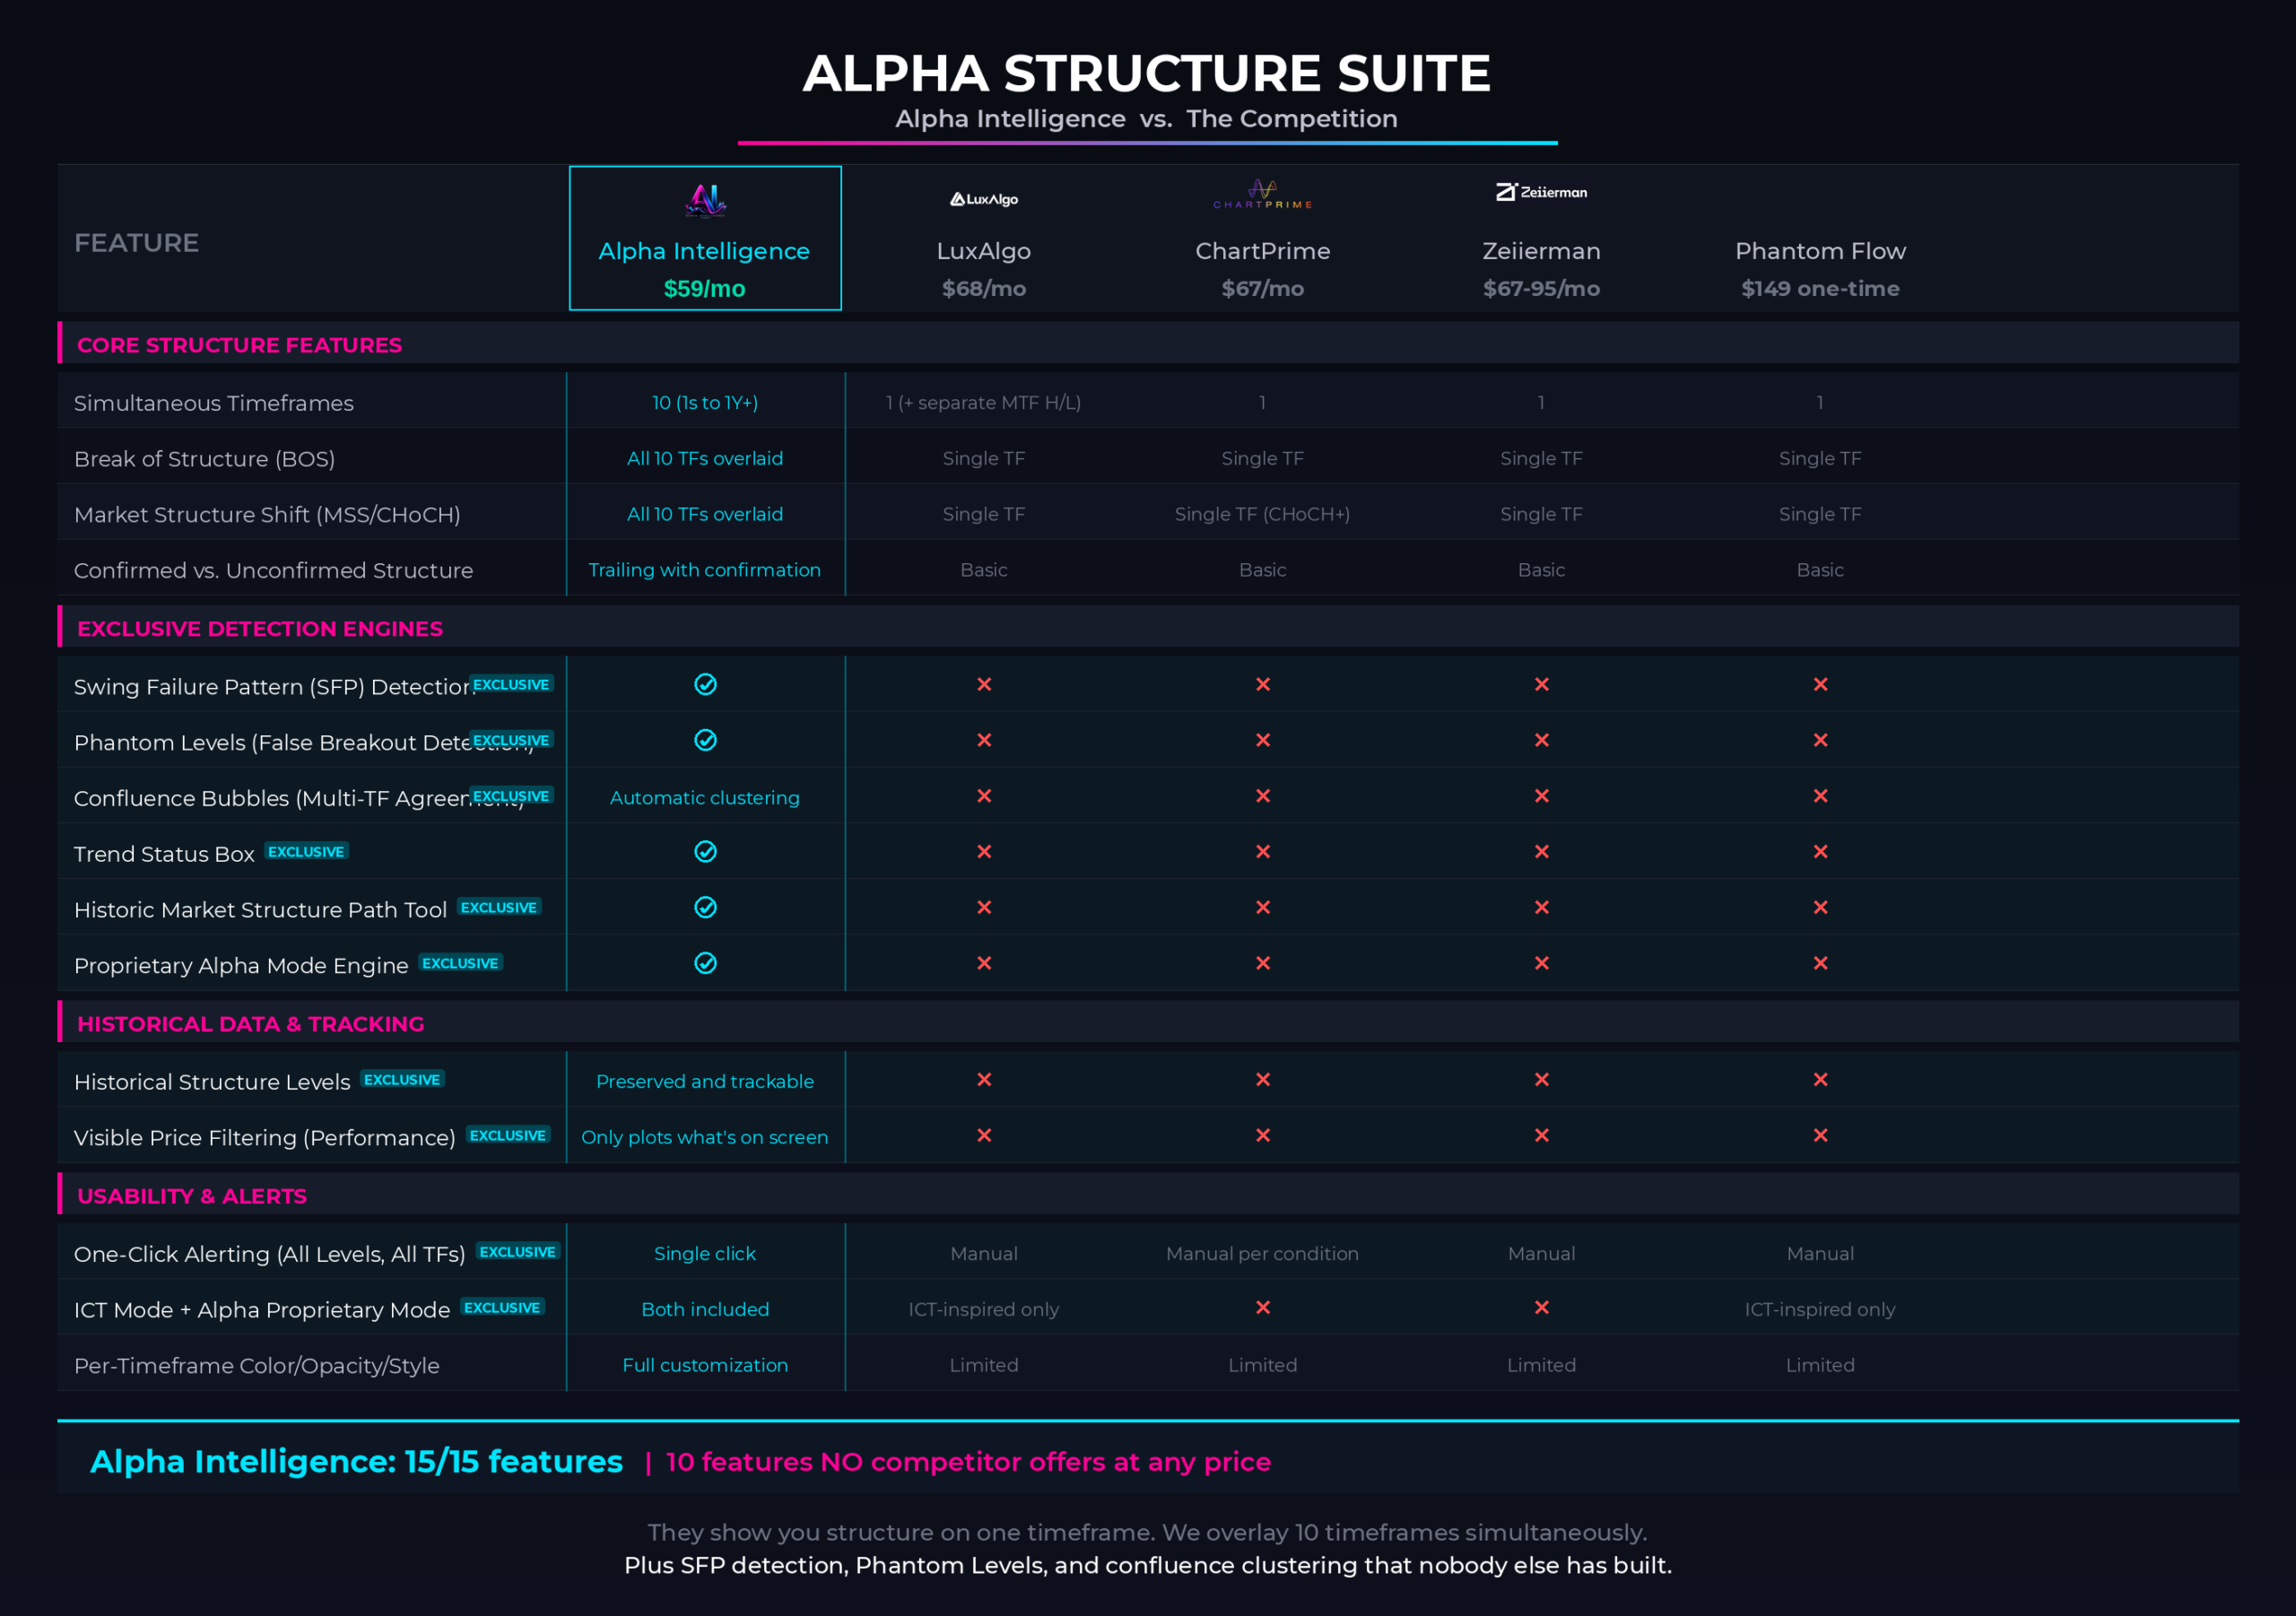
THE COMPETITION DOESN'T COMPARE... AND IT IS NOT EVEN CLOSE
How Does Alpha Structure Suite
Stack Up Against The TOP Competition?
Alpha Structure Suite offers features that no other indicator on the market offers, and significantly outperforms anything available to date. Here is how…
*Click On The Image Below To Zoom In*
✕
✕
There is not a SINGLE indicator in the market that actually offers the “Historical H/L/Path” OR “Multi-TF Structural H/L Displays”. Every wondered… WHY?
✕LuxAlgo’s Market Structure indicator doesn’t plot multiple timeframes.
✕ChartPrime’s Market Structure indicator doesn’t have DUAL DETECTION engines, and their ICT engine underperforms.
✕Zeiierman’s Market Structure indicator doesn’t have accurate Swing Failure Pattern Detection.
✕Phantom Flow’s Market Structure indicator can’t tell you where BOS & MSS happens on 10 timeframes at the same time.
✕Our has 10 features that no other indicator in the ENTIRE indicator’s market offers.
THE ALPHA INTELLIGENCE ALPHA STRUCTURE SUITE
A Complete Institutional Toolkit. One Subscription.
FEATURES & SPECS
ABOUT MARKET STRUCTURE
- CONFIRMED HIGHS AND LOWS
•Alpha Structure Suite identifies confirmed highs and lows at every timeframe. A confirmed high is a price level that has been tested and held. A confirmed low is a price level that has been tested and held. These are the key structural levels.
•
When price approaches a confirmed high, sellers are waiting. When price approaches a confirmed low, buyers are waiting. These are high-probability reversal zones. Trade them.
BREAKS OF STRUCTURE•
When price closes beyond a confirmed high or low, in the same direction as the trend, a break of structure is occurring.
•
This is a directional signal.
•
When price breaks above a confirmed high, an uptrend is likely to continue.
•
When price breaks below a confirmed low, a downtrend is likely to continue.
•
Alpha Structure Suite detects breaks of structure in real-time.
•
You see the break before most traders notice it. You are positioned before the move happens.
MARKET STRUCTURE SHIFTS•
When price breaks a confirmed level in the opposite direction from the previous break, a market structure shift is occurring. This is a reversal signal. The trend may be changing. A new trend may be forming.
•
Alpha Structure Suite detects market structure shifts in real-time. You see the reversal signal before most traders notice it. You are positioned before the move happens.
SWING FAILURE PATTERNS•
A swing failure pattern occurs when price wicks beyond a confirmed level but closes back inside. This is a liquidity sweep. Institutional traders are testing the level to trigger stop-loss orders. When price closes back inside, institutional rejection is clear.
•
SFPs are high-probability reversal signals. When you see an SFP at a confirmed level, prepare for a strong reaction in the opposite direction.
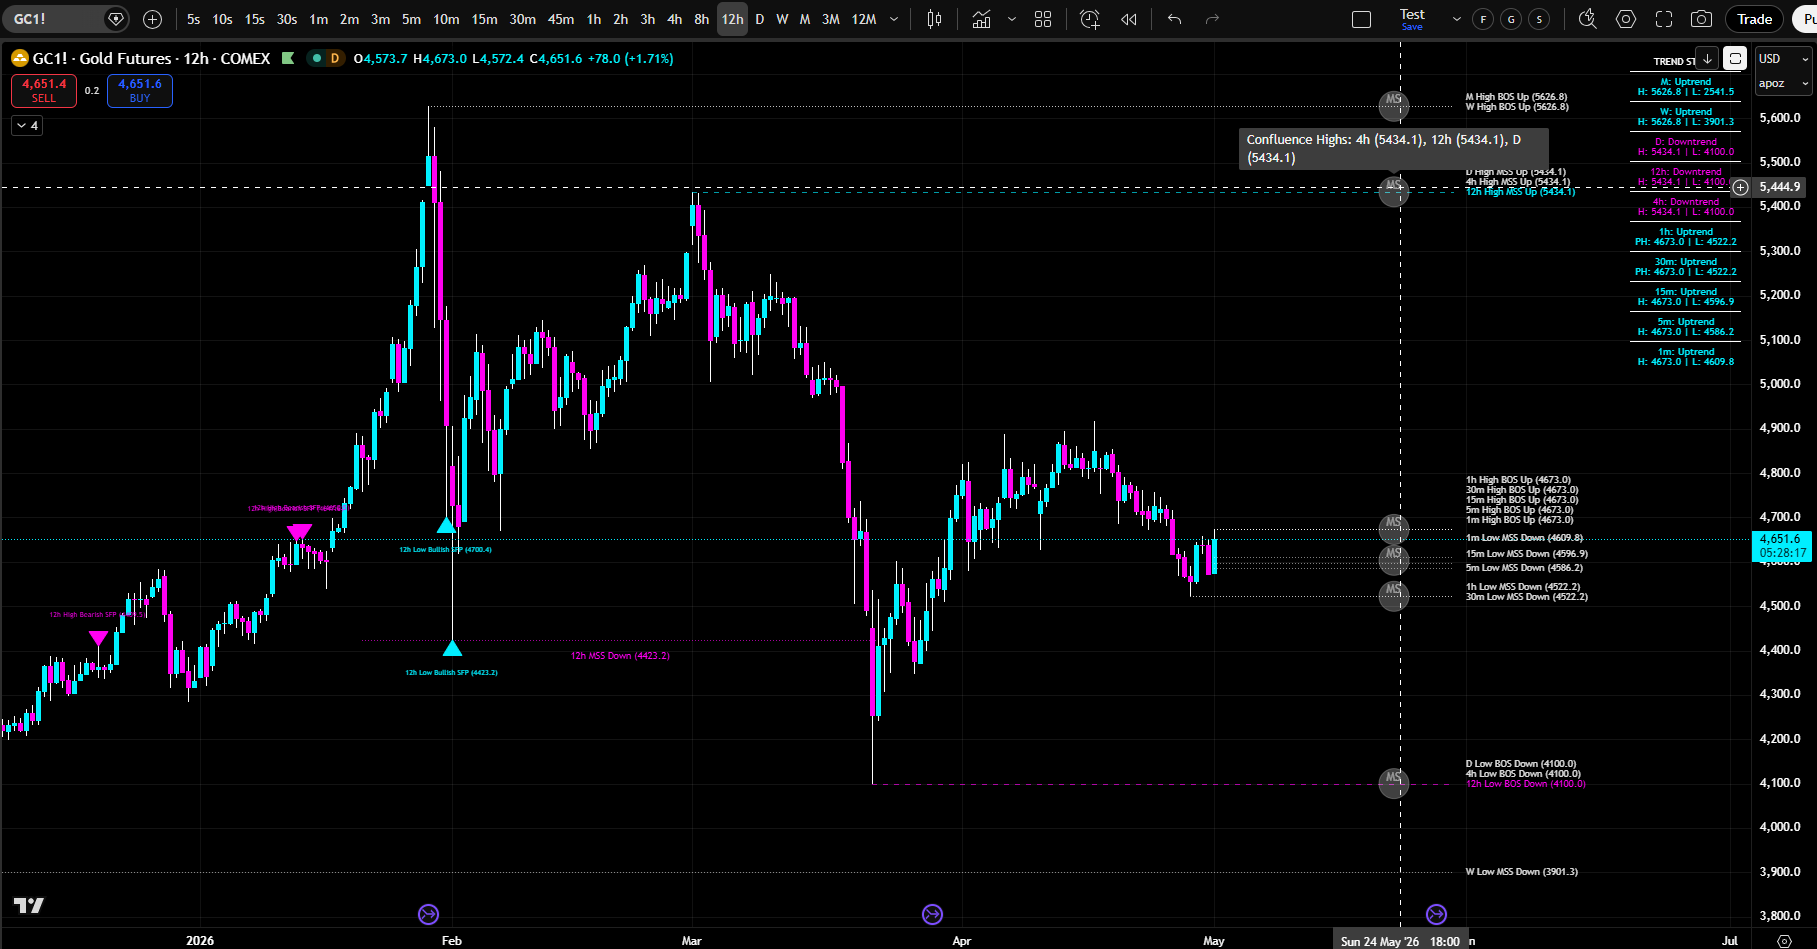
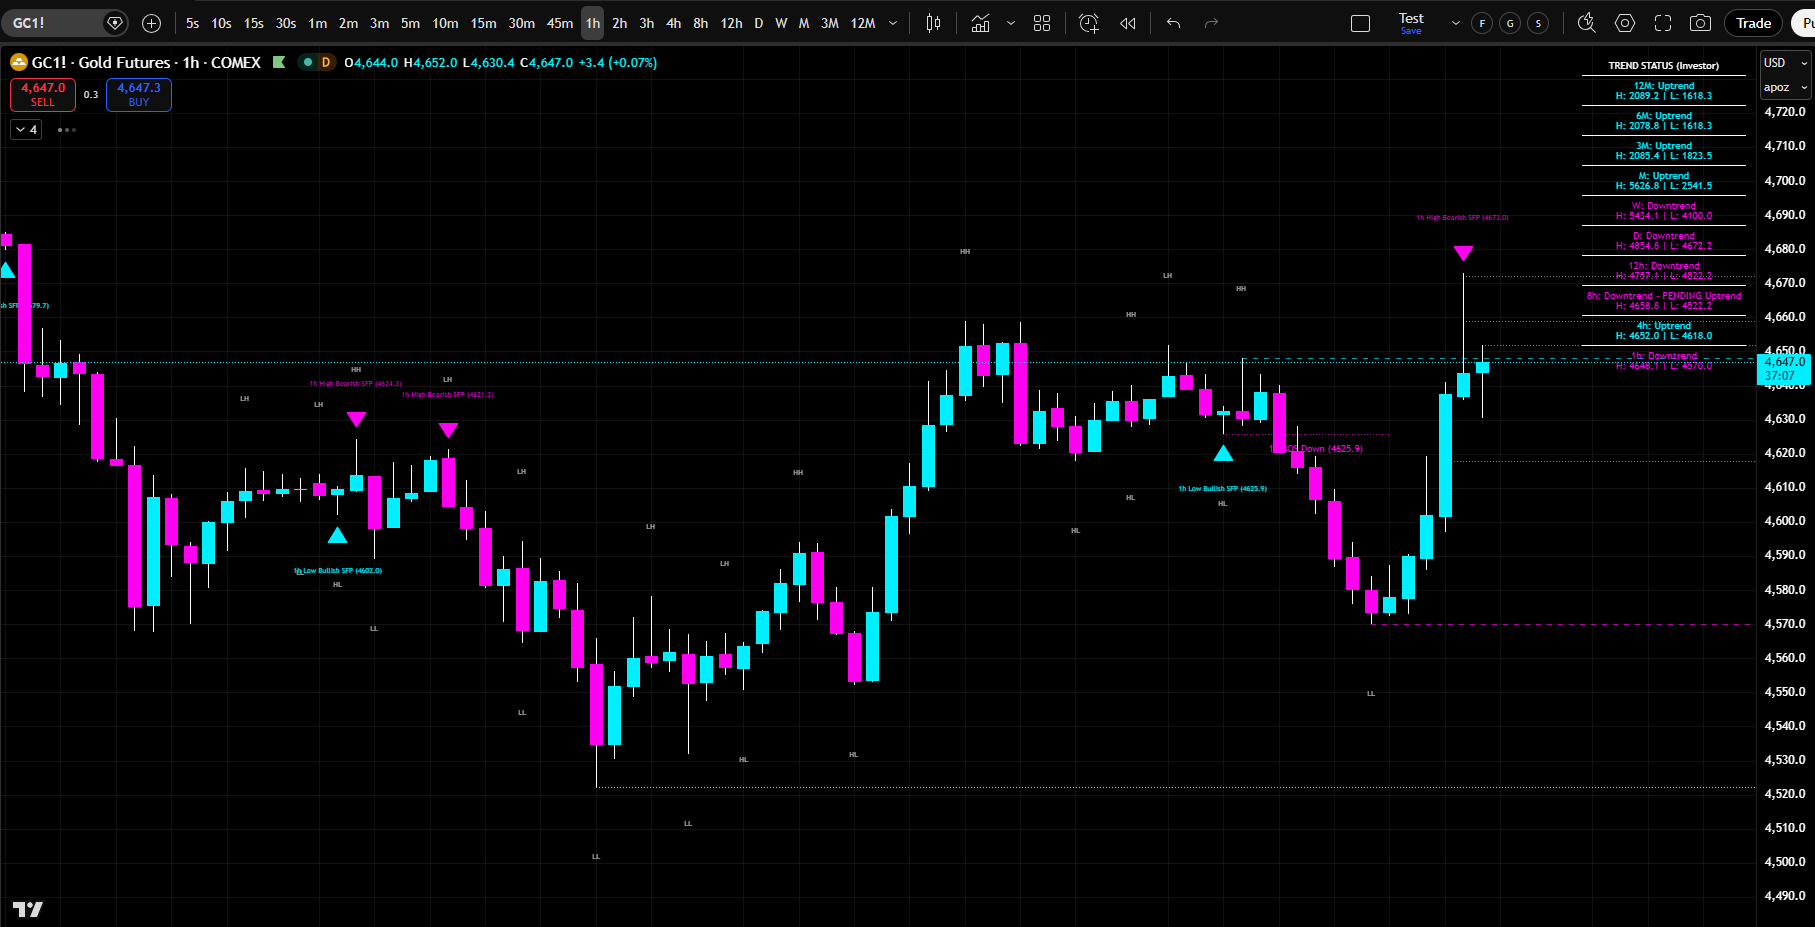
MULTI-TIMEFRAME STRUCTURAL CONFLUENCE
Know exactly what charts are in what trends, and when those trends fail – BEFORE price gets there.
Every confirmed high and confirmed low on your chart is a decision point — a line in the sand where the market declared its intent. When that line breaks, it tells you whether the trend is continuing or reversing.
• •The problem is that tracking structure across multiple timeframes manually is nearly impossible, and it takes HOURS to do per chart or asset.
•You would need to flip between 10 charts, remember every swing high and low (or plot them manually), track which levels have been broken and in which direction (whether a BOS or MSS, uptrend or downtrend), and somehow synthesize all of that into a single trading decision
•The Alpha Structure Suite does all of this automatically, in SECONDS (not hours), and plots it on ANY chart / asset that you pull up in TradingView.
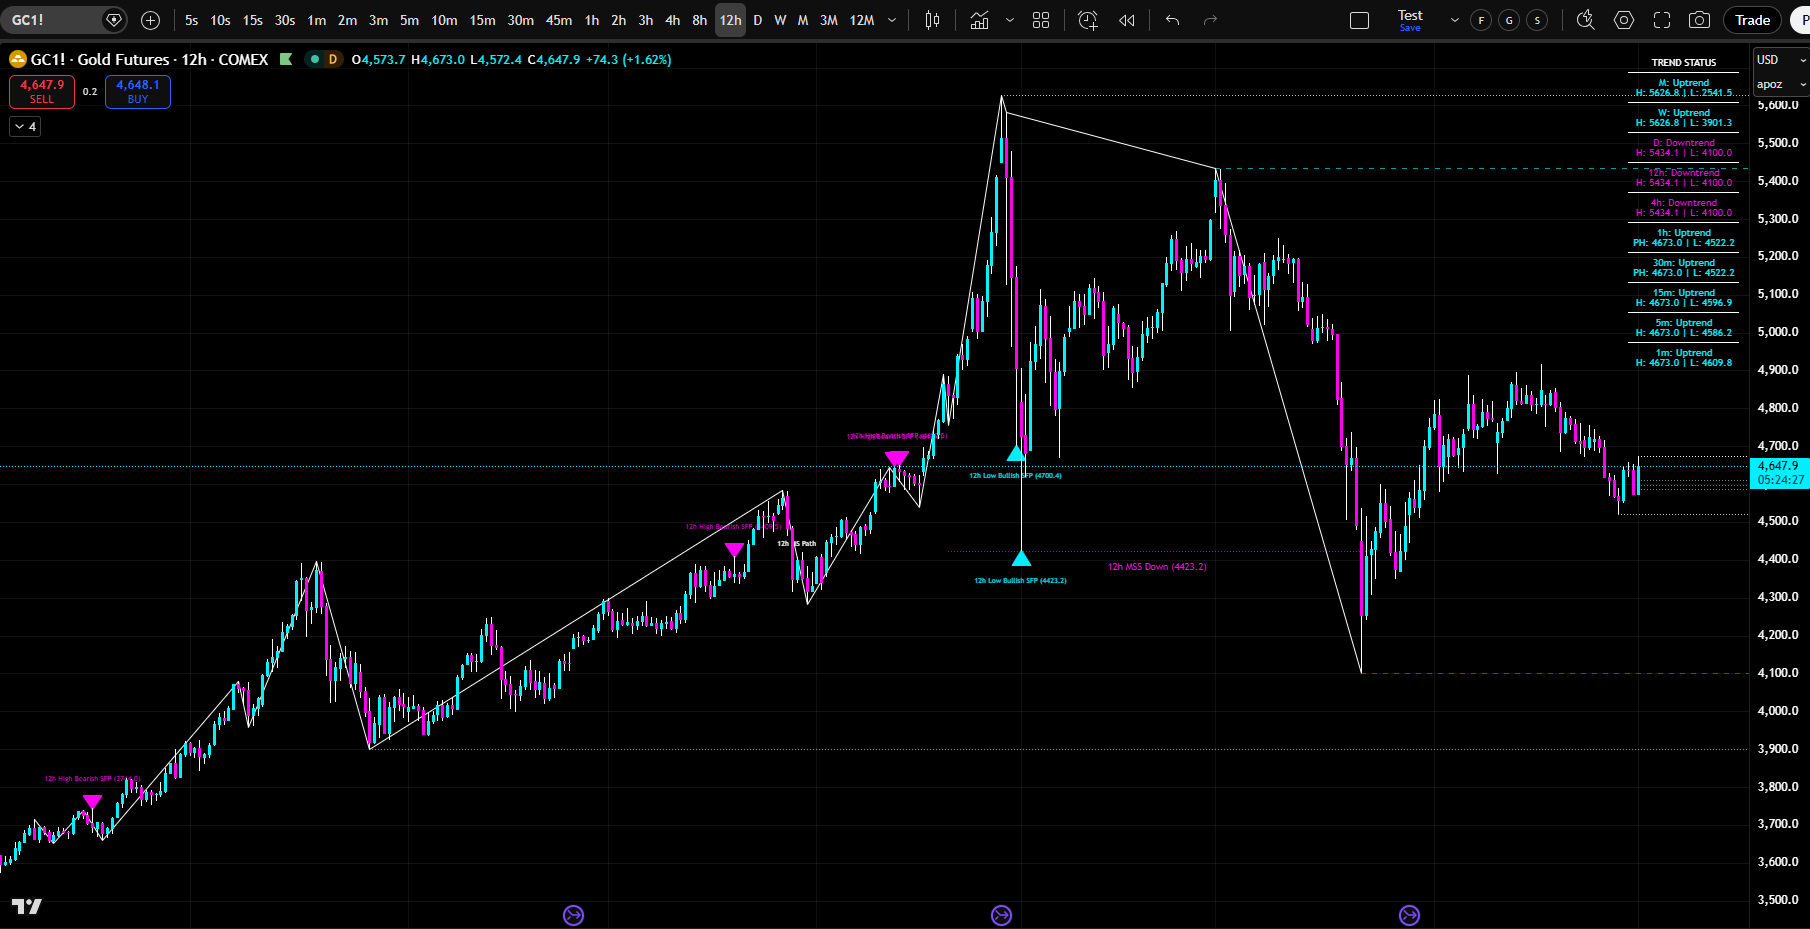
•It identifies confirmed highs and lows, detects breaks of structure and market structure shifts, catches swing failure patterns where liquidity was swept, and determines trend direction.
•Alpha Structure Suite calculates market structure across ten timeframes simultaneously. When multiple timeframes have confirmed highs or lows at the same price zone, that is institutional confluence. That is where the strongest reactions occur.
•Imagine seeing that the 1-minute, 5-minute, 15-minute, and 1-hour timeframes all have confirmed lows at the same price zone. That is not just a support level. That is a high-probability reversal zone. That is where institutional traders across multiple timeframes are positioned. That is where price will react with force.
•
•
•
This is what Alpha Structure Suite shows you. This is what separates professional traders from retail traders.
WHAT IS INCLUDED IN ALPHA STRUCTURE SUITE?
Dual Detection Engines
•
Alpha Mode (proprietary): proprietary confirmation rules & phantom level system — fewer false signals, more conservative
•
Standard/ICT Mode: Industry-standard 3-candle pivot detection with CHoCH and HH/HL/LH/LL classification
•
•
Switch between engines anytime with a single dropdown
10 Simultaneous Timeframes•
Up to 10 independent timeframe slots running at once
•
Each slot has its own confirmed highs/lows, trend direction, and structural events
•
Each timeframe’s highs/lows you choose are plotted on whatever timeframe chart you are viewing, up to 10 timeframes plotted on a single chart so you always have the full picture
•
Timeframes are sovereign — they do not influence each other
•
Per-slot enable/disable toggles, for full customization
5 Trader Timeframe Templates•
Alpha (default): 1m, 5m, 15m, 30m, 1H, 4H, 12H, D, W, M
•
Scalper: 1m, 3m, 5m, 10m, 15m, 30m, 1H, 2H, 4H, D
•
Day Trader: Same as Alpha
•
Swing Trader: 15m, 30m, 1H, 4H, 12H, D, 3D, W, M, 3M
•
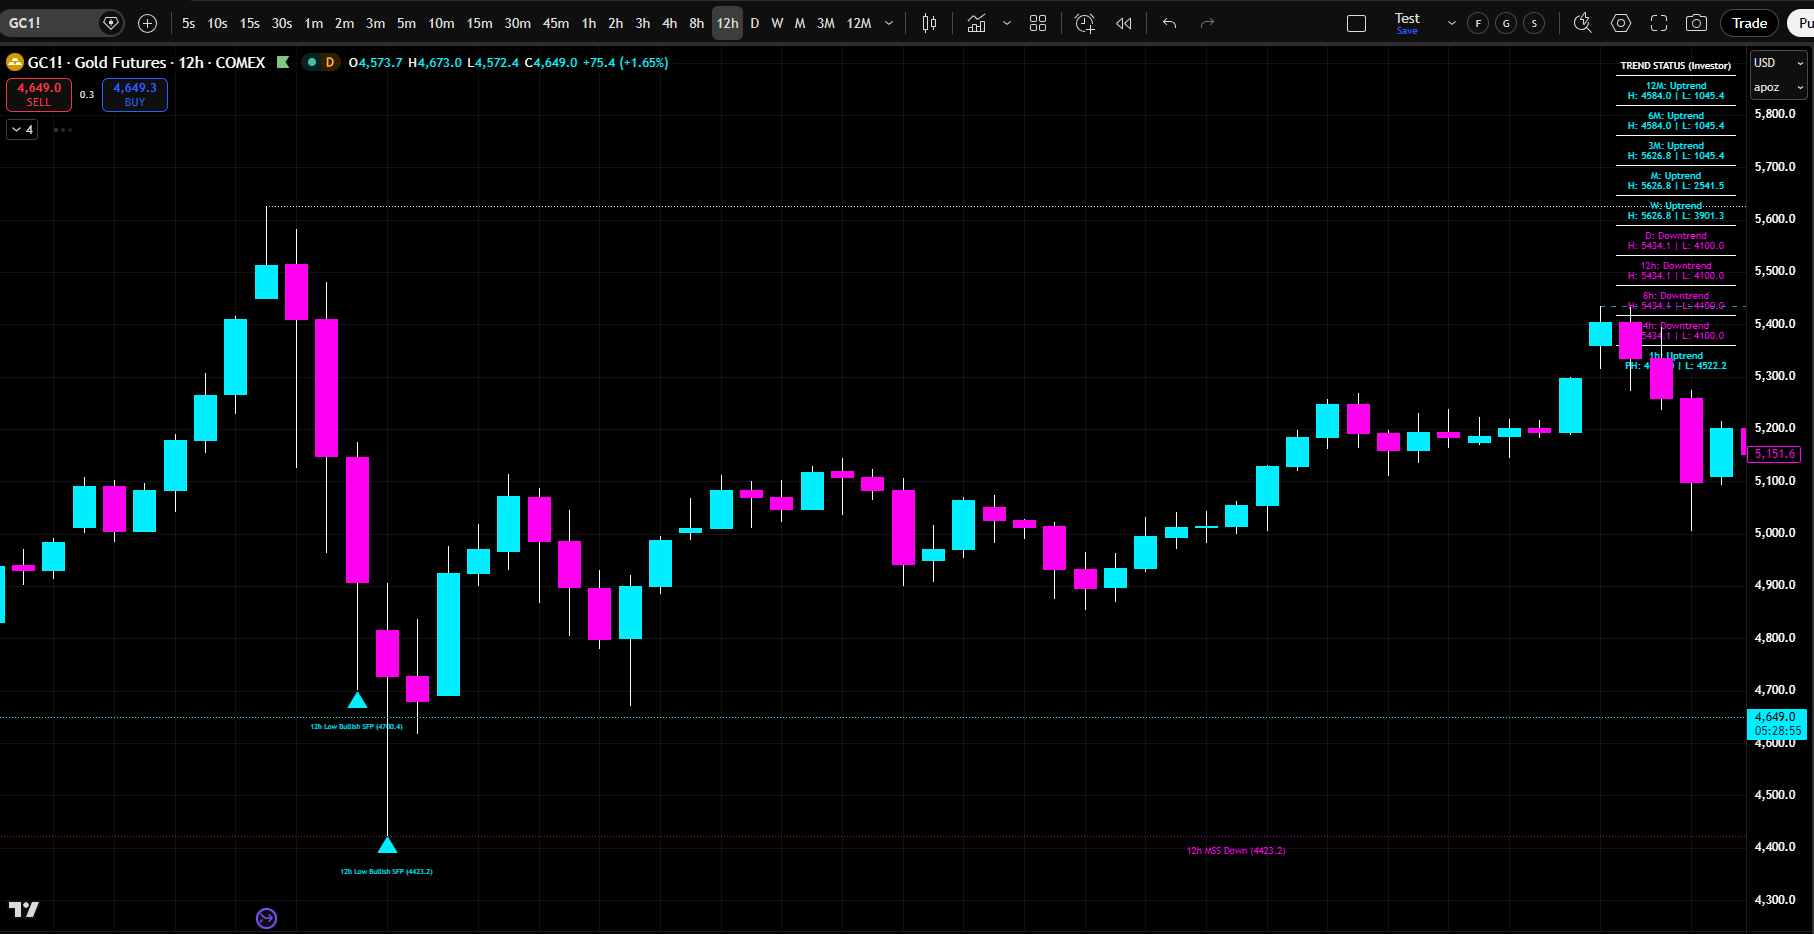
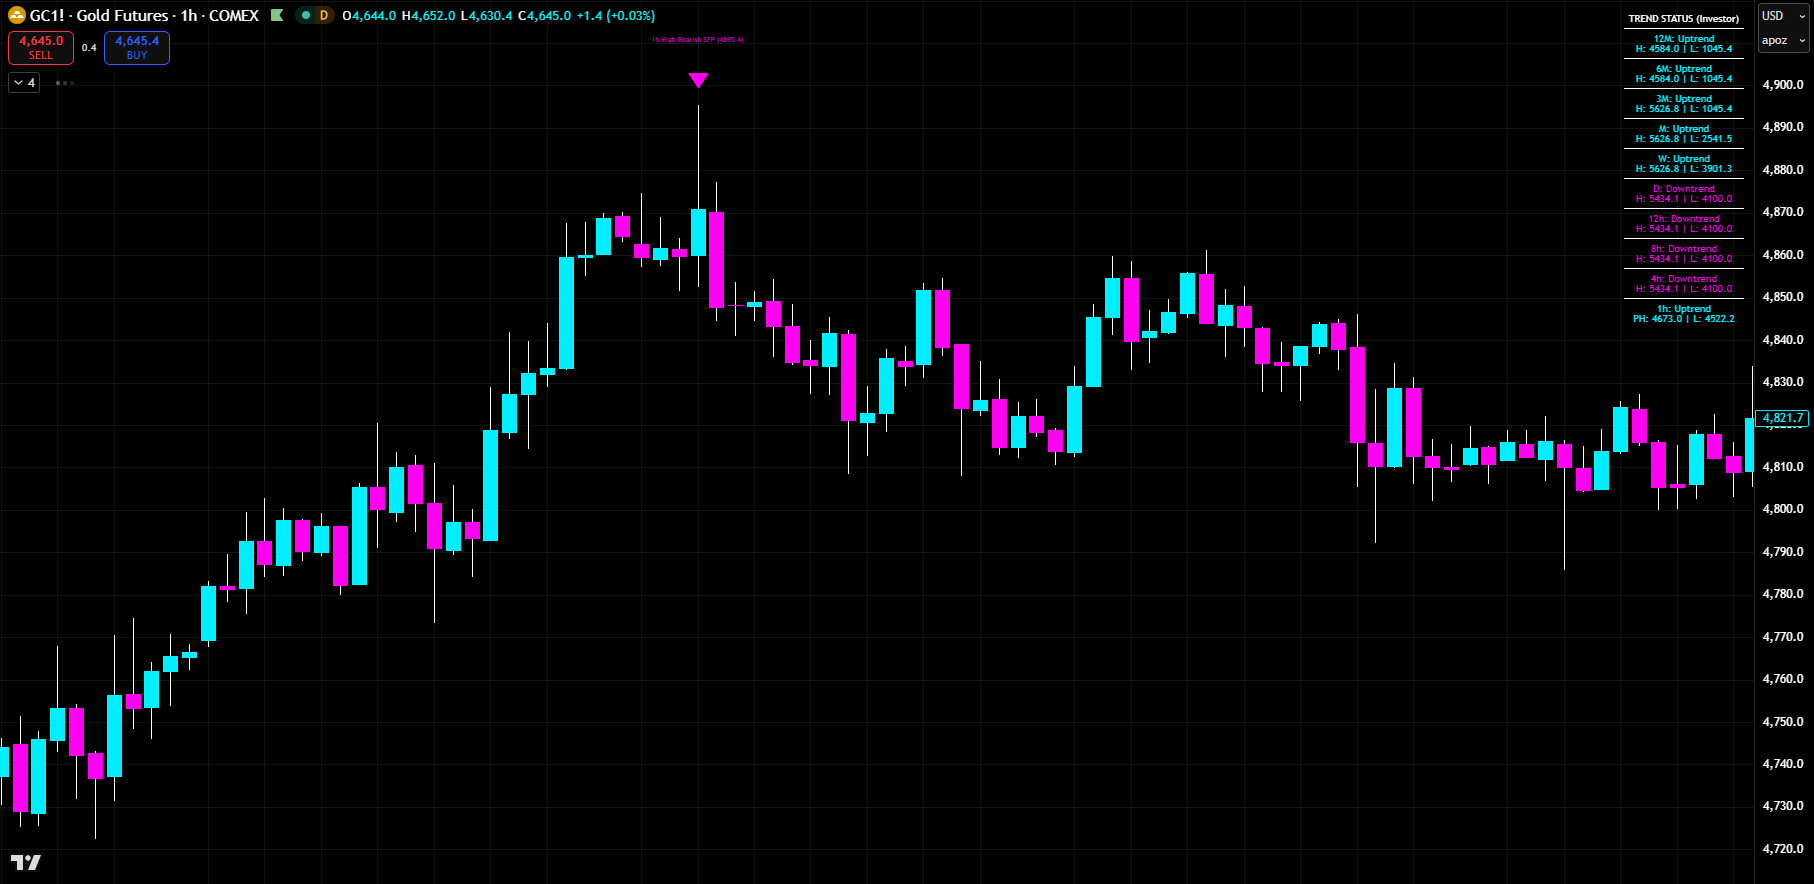
Investor: 1H, 4H, 8H, 12H, D, W, M, 3M, 6M, 12M
WHAT DOES ALPHA STRUCTURE AUTOMATICALLY PLOT ON YOUR CHART?
Phantom Levels (Alpha Mode Only)
•
Proprietary innovation unique to Alpha Intelligence
•
Created when a Swing Failure occurs
•
Forces the market to break the most extreme level, not just the original
•
Reduces false breakout signals significantly
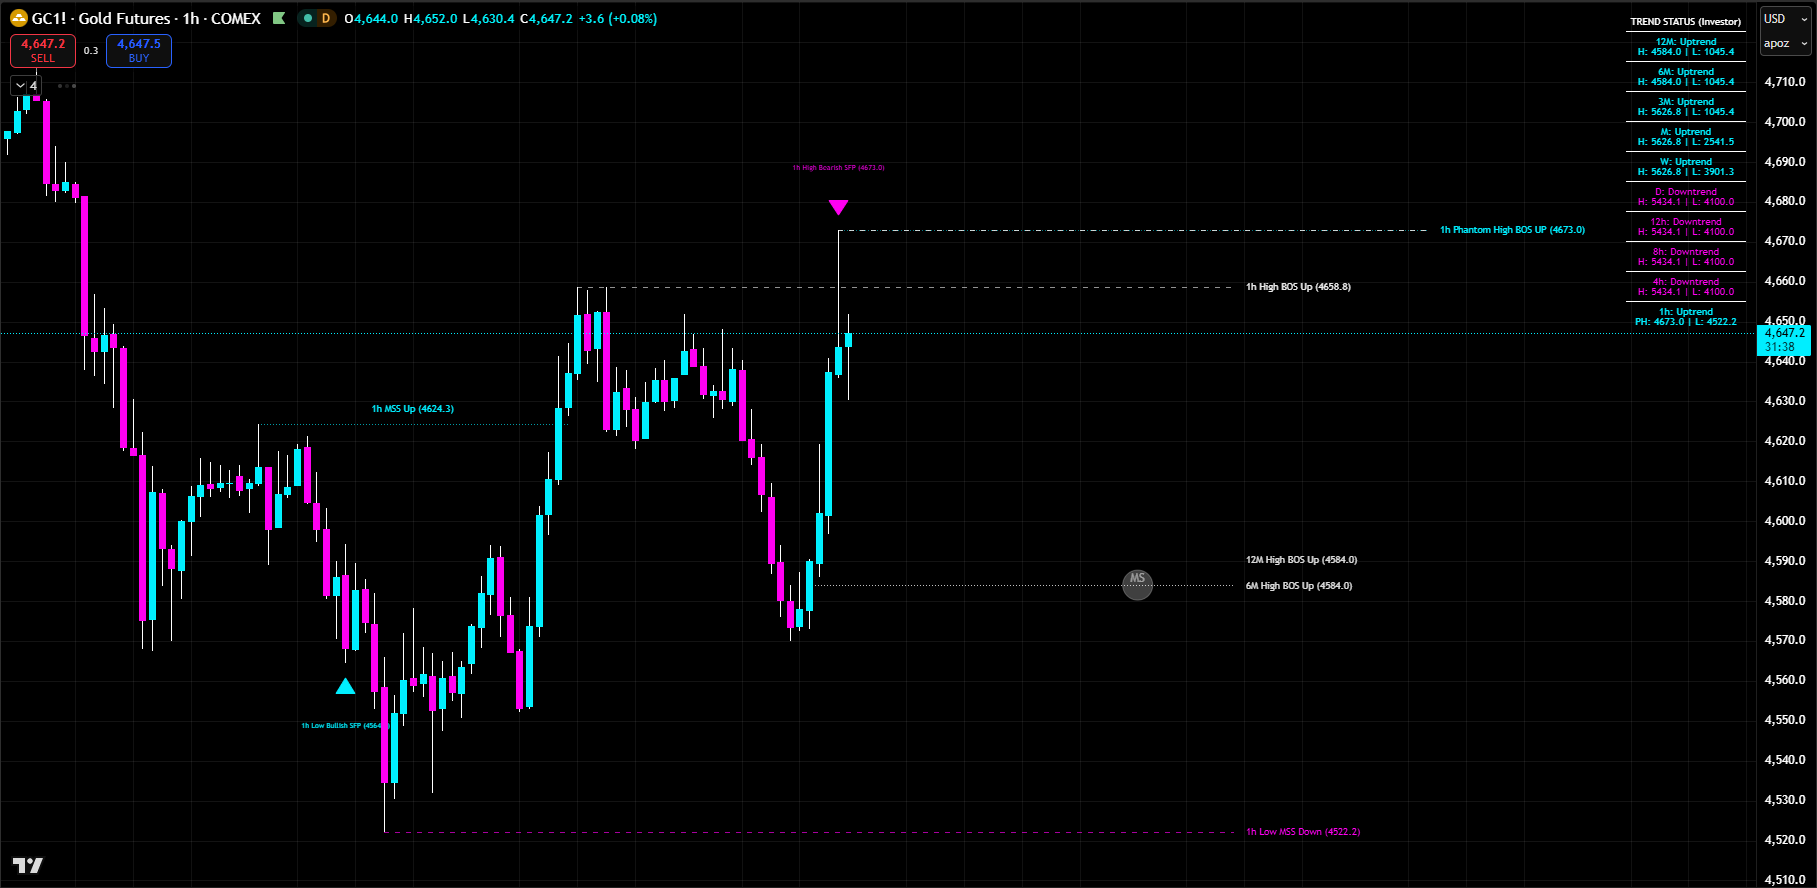
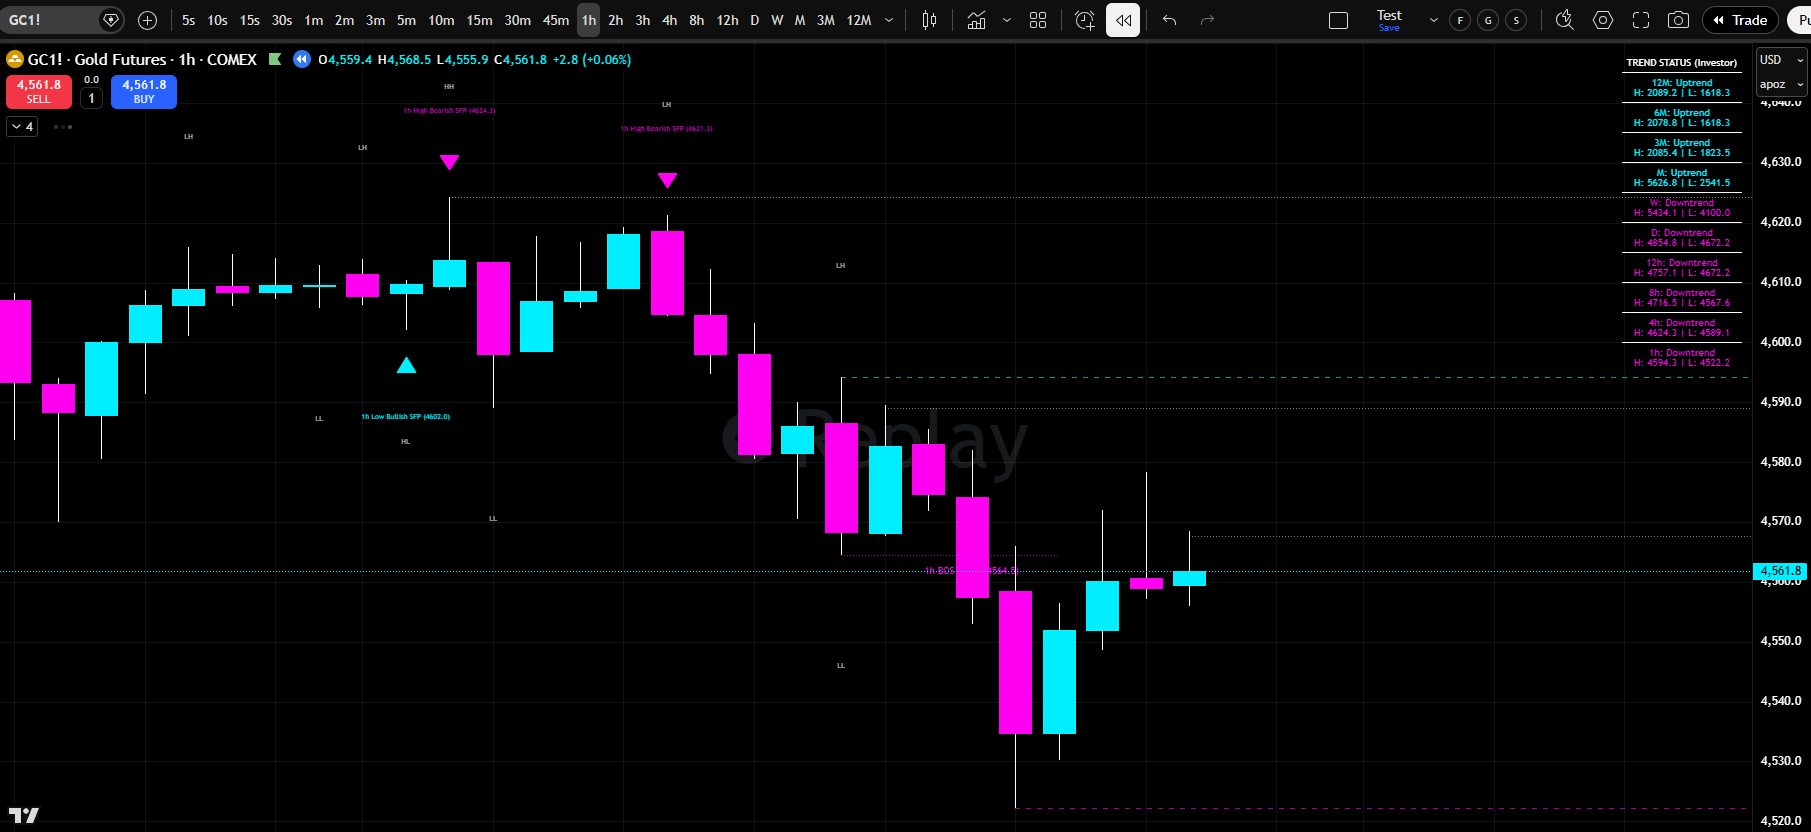
SFP Signal Detection
•
Cyan triangles below candles = bullish SFP (wick below confirmed low, close back above)
•
Pink triangles above candles = bearish SFP (wick above confirmed high, close back below)
•
Indicates attempted price level and/or liquidity sweeps at confirmed highs/lows — then institutional rejection
•
Independent per-timeframe SFP toggles
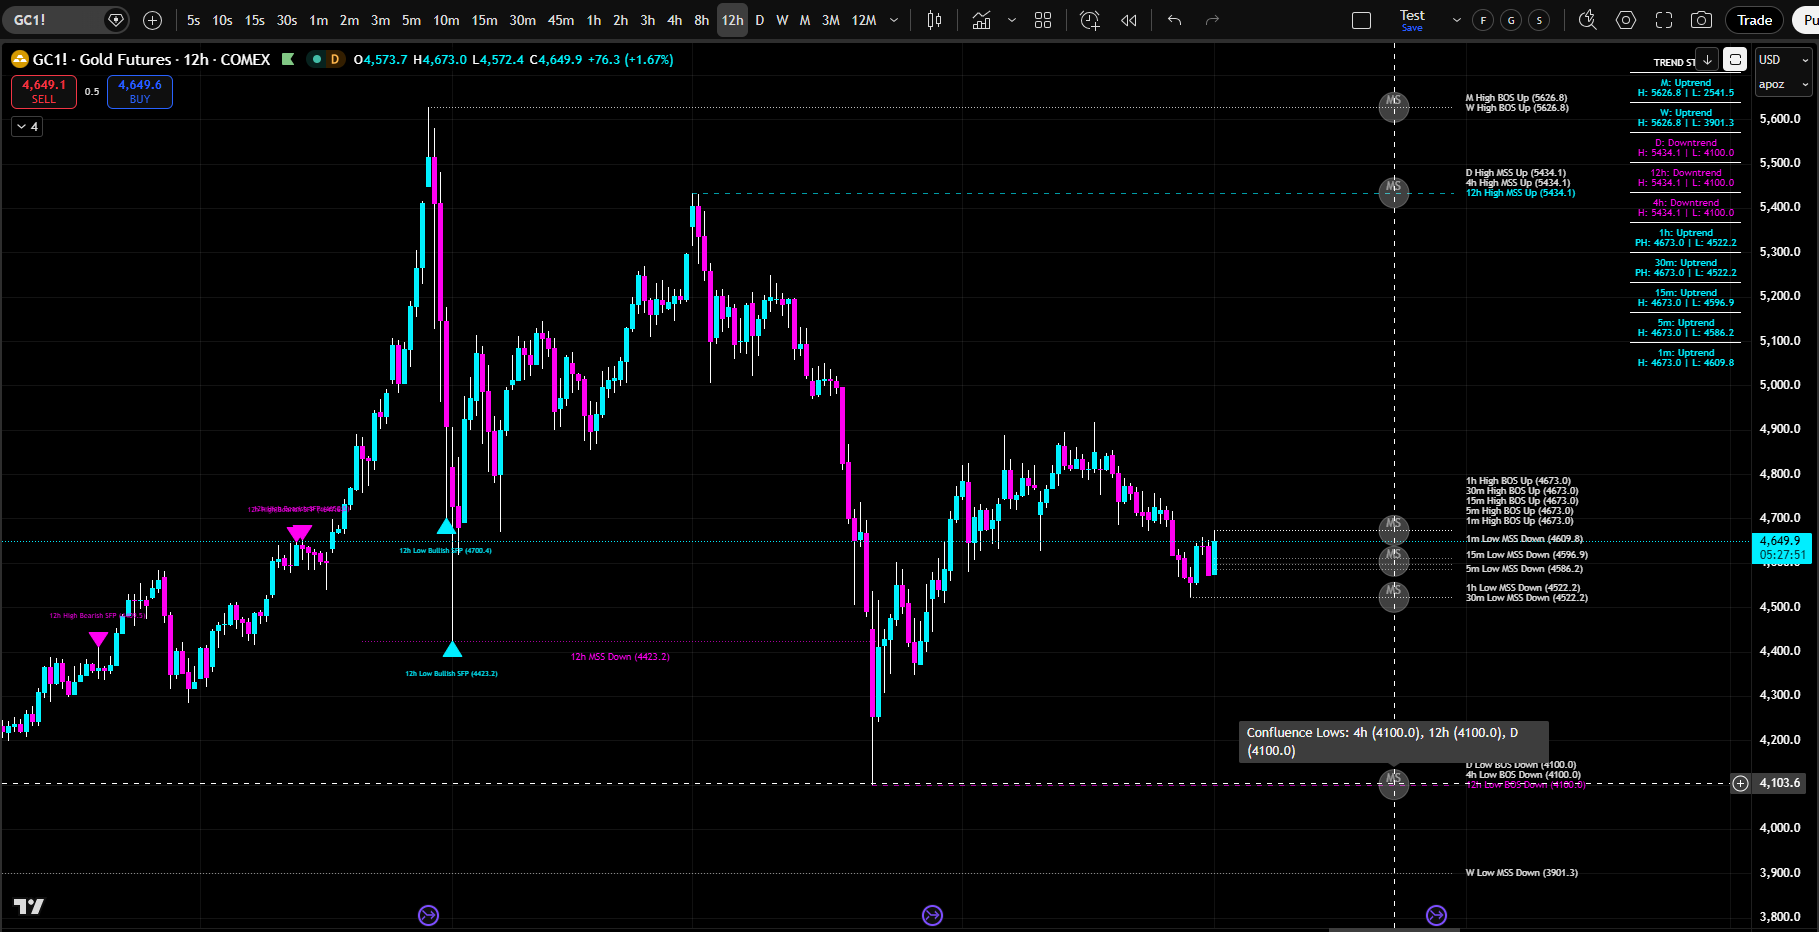
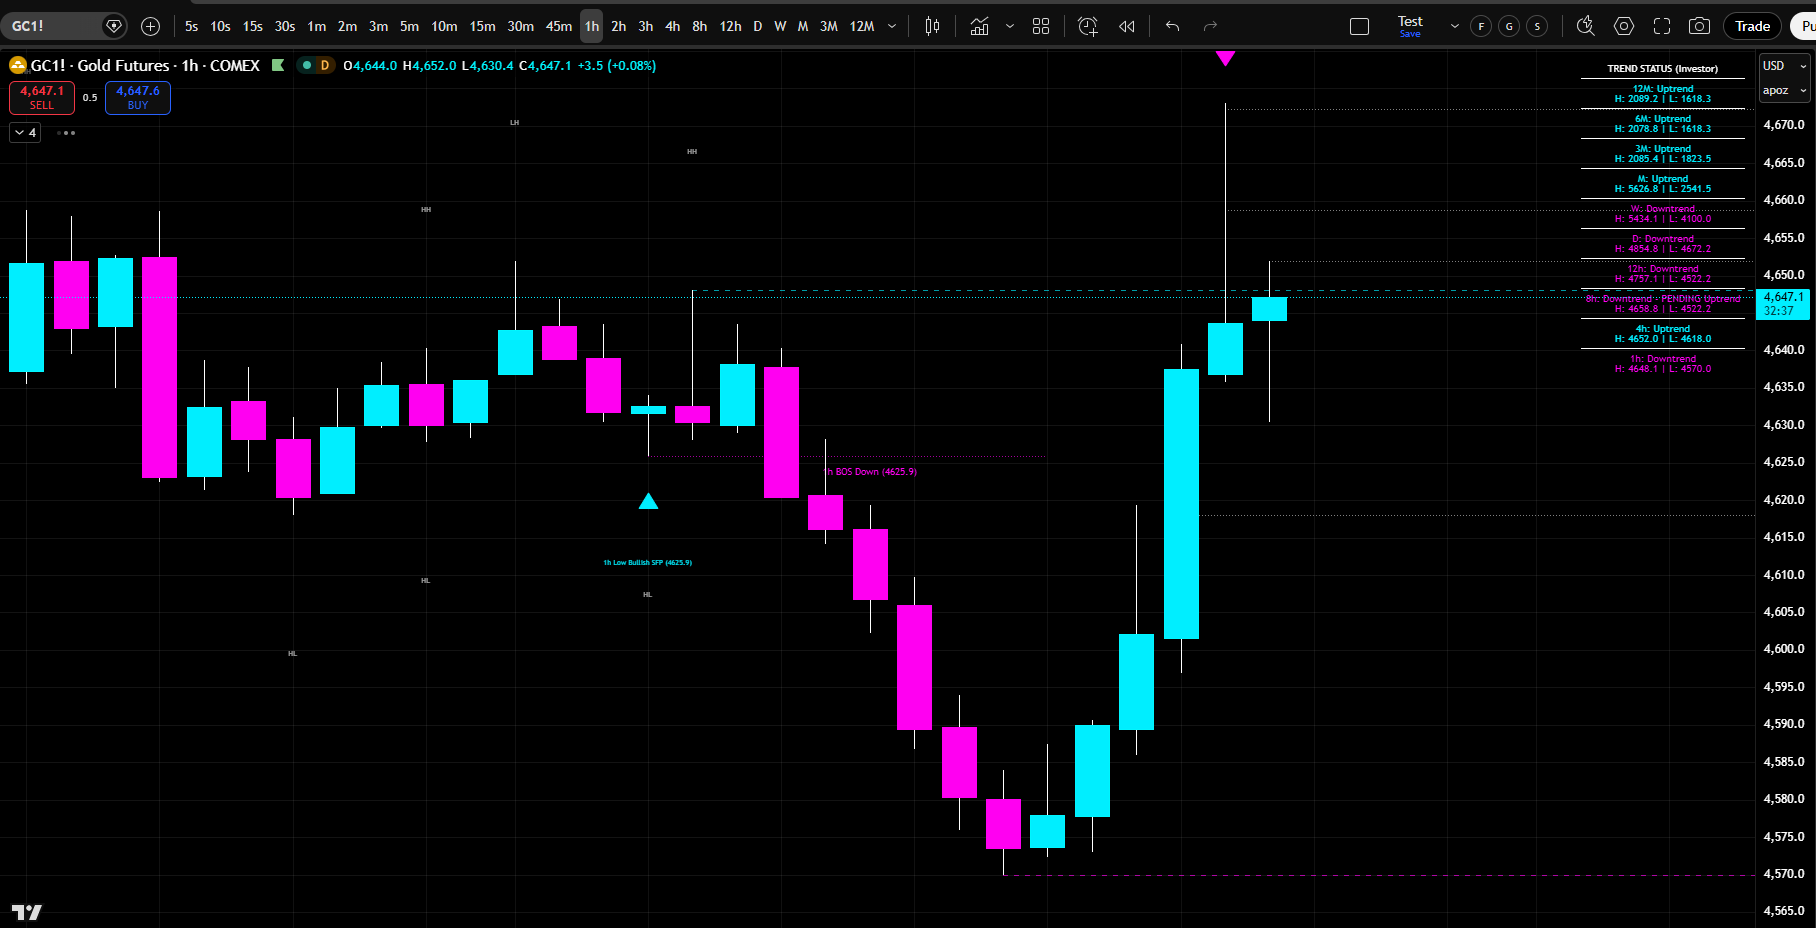
BOS & MSS Event Lines
•
BOS (Break of Structure) in cyan = trend continuation
•
MSS (Market Structure Shift) in pink = potential trend reversal
•
Dotted lines connecting the confirmed level to the break candle
•
Only the most recent event shown per timeframe to keep the chart clean
•
Historical BOS/MSS toggle available with configurable max count
CHoCH Lines (Standard/ICT Mode)
•
Change of Character = first break against the current trend
•
Early warning that a reversal may be forming
•
CHoCH is the warning; MSS is the confirmation
•
Historical CHoCH display with independent styling
HH/HL/LH/LL Swing Classification (Standard/ICT Mode)
•
Every confirmed swing classified as Higher High, Higher Low, Lower High, or Lower Low
•
Labels placed directly on candles
Market Structure Path Tool
•
Zigzag line connecting confirmed swing highs and lows
•
Up to 10 independent paths (one per timeframe slot)
•
Individual color, thickness, and opacity per path
•
Visually confirms uptrend (rising zigzag) or downtrend (falling zigzag)
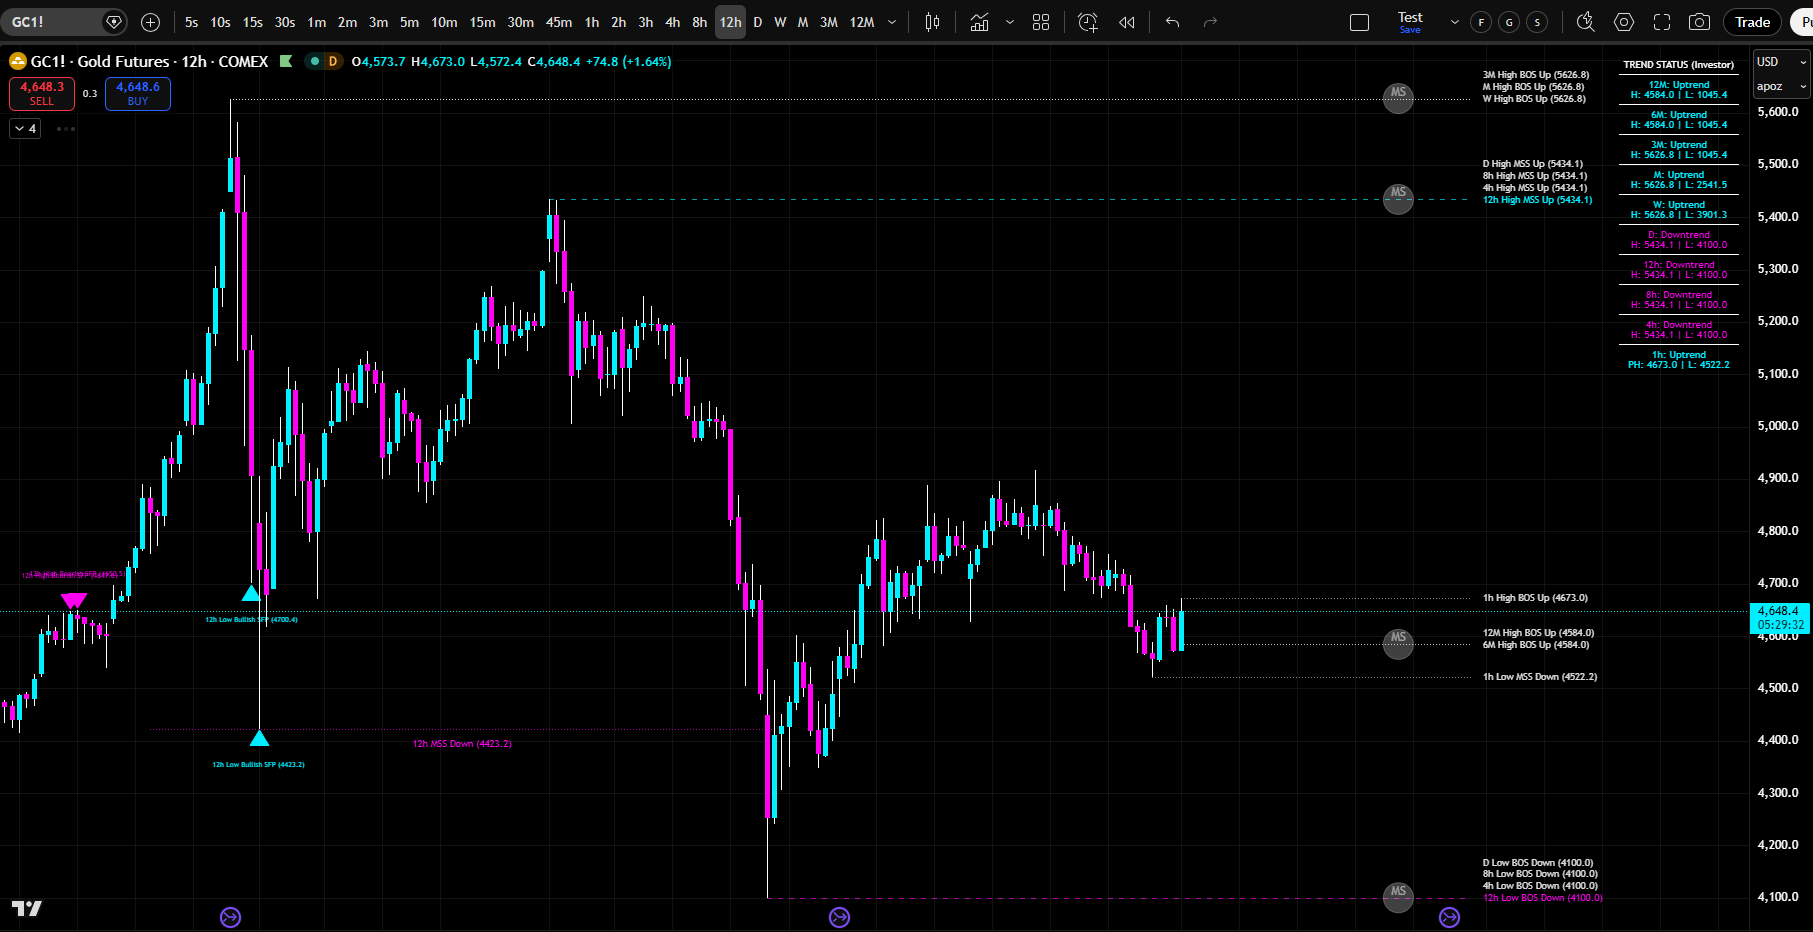
Trend Status Box
•
Real-time multi-timeframe trend display in any corner of your chart
•
One row per enabled timeframe, sorted highest to lowest
•
•
Shows confirmed high and low prices per timeframe
•
Pending state display in Standard mode (current trend + pending new trend)
Confluence Bubbles
•
Zones where multiple timeframes have confirmed levels at the same price
•
•
Configurable cluster threshold (% distance) and minimum levels required
•
Customizable bubble color, size, opacity, and offset
Historical Levels
•
See the prior BOS events, and how price reacted afterward
•
See the prior MSS events, and how price reacted afterward
•
See the prior CHoCH events, and how price reacted afterward
•
See the prior SFP Signals, and how price reacted afterward
FULL CUSTOMIZATION & CONTROL
Alert Engine
•
BOS event alerts
•
MSS event alerts
•
SFP signal alerts
•
CHoCH event alerts (Standard mode)
•
Swing classification alerts (Standard mode)
•
Trend change alerts
•
Customizable alert prefix and mute duration
•
All of this, with the single click of a button. This would normally take a trader hours to manually “set alerts” for every line (let alone track them all)
•
Granular Per-Timeframe Visibility
Styling & Customization•
Independent toggles for H/L lines, H/L labels, SFP signals, phantom lines, and phantom labels per slot
•
Make lines invisible while keeping logic active
•
Show SFPs but hide phantoms, or any combination
•
Full control over exactly what appears on your chart
•
Independent color, opacity, thickness, and style for confirmed H/L lines
•
Independent styling for phantom lines
•
Independent styling for BOS/MSS lines
•
Independent styling for CHoCH lines (Standard mode)
•
Independent styling for the Trend Status box (border, heading, uptrend/downtrend colors)
•
Text size options: Tiny, Small, Normal, Large, Huge
Performance & Optimization•
3 performance modes: Full Quality, Balanced (recommended), High Performance
•
Configurable Max Swing History (1–500, default 20)
•
Visible price range filtering prevents chart zoom-out
ALPHA STRUCTURE Suite By Alpha Intelligence
Find Where Institutional Traders Spent the Most Time.
Trade Where Price Wants to Return.
Alpha Structure Suite is the most sophisticated market structure indicator ever built for TradingView.
✕
✕It identifies confirmed highs and lows across up to ten simultaneous timeframes.
✕It detects breaks of structure and market structure shifts.
✕It identifies swing failure patterns and liquidity sweeps.
✕It calculates multi-timeframe confluence zones.
✕And it shows you the exact structural path price is taking at every level of the market.
Standard Market Structure indicators and analysis is incomplete.
It shows you one way to look at the market, with no historical data to back it up.
It doesn’t show you confluence.
It doesn’t show you multi-timeframe levels.
It doesn’t show you Market Structure Shifts, Breaks of Structure, or Changes in Character or the State of Delivery.
It doesn’t show you where Swing Failures happen, NOR what that means for market structure.
Alpha Structure Suite changes it all.
It is built on an over 10+ year proprietary methodology that prevents you from getting “faked out”.
IT DOES THE WORK FOR YOU
You Don’t Have to Know Why It Works.
Just Watch It Work.
Professional traders read market structure like a map.
Alpha Structure Suite gives you institutional-grade market structure analysis that shows you exactly where price is likely to go at every timeframe.
Don’t Understand Market Structure, Trends, OR SFPs? It doesn’t matter!
You don’t have to know any of that.
The indicator already knows.
It plots every level for you, automatically, in real time, across every timeframe that matters.
Just turn it on. Watch what happens when price reaches the levels it plots.
Use the historical levels function and scroll back through any chart — you will see it for yourself.
These levels work. Visibly. Repeatedly. Undeniably.
GET STARTED TODAY
One Plan. Everything Included. Any Market.
$59 / month
Less than one bad trade.
Less than LuxAlgo’s single-tier plan.
Less than the cost of one month of “figuring it out yourself.”
No contracts. No hidden fees. Almost INSTANT TradingView access. Any chart. Any market. Cancel anytime. But You Won’t…