
Naked POC Suite
The price levels where institutional money transacted — and never came back to settle the score.
Watch The Below Video!
8 timeframes. Automatic. Real time.
These are the levels professional traders use as their primary reference.
Now they’re on your chart. In seconds.
Almost INSTANT TradingView access. Any chart. Any market. Cancel anytime.

When the Daily POC, Weekly POC, and London Session POC all cluster at the same price — that’s not a coincidence.
That’s where institutional traders across three different sessions spent the most time.
That’s where price will react. Hard.
Naked POC Suite finds these clusters automatically.
It tells you when price is approaching them. It alerts you the moment price hits. You don’t analyze it. You just act on it.
THE COMPETITION DOESN'T COMPARE... AND IT IS NOT EVEN CLOSE
How Does Naked POC Suite
Stack Up Against The TOP Competition?
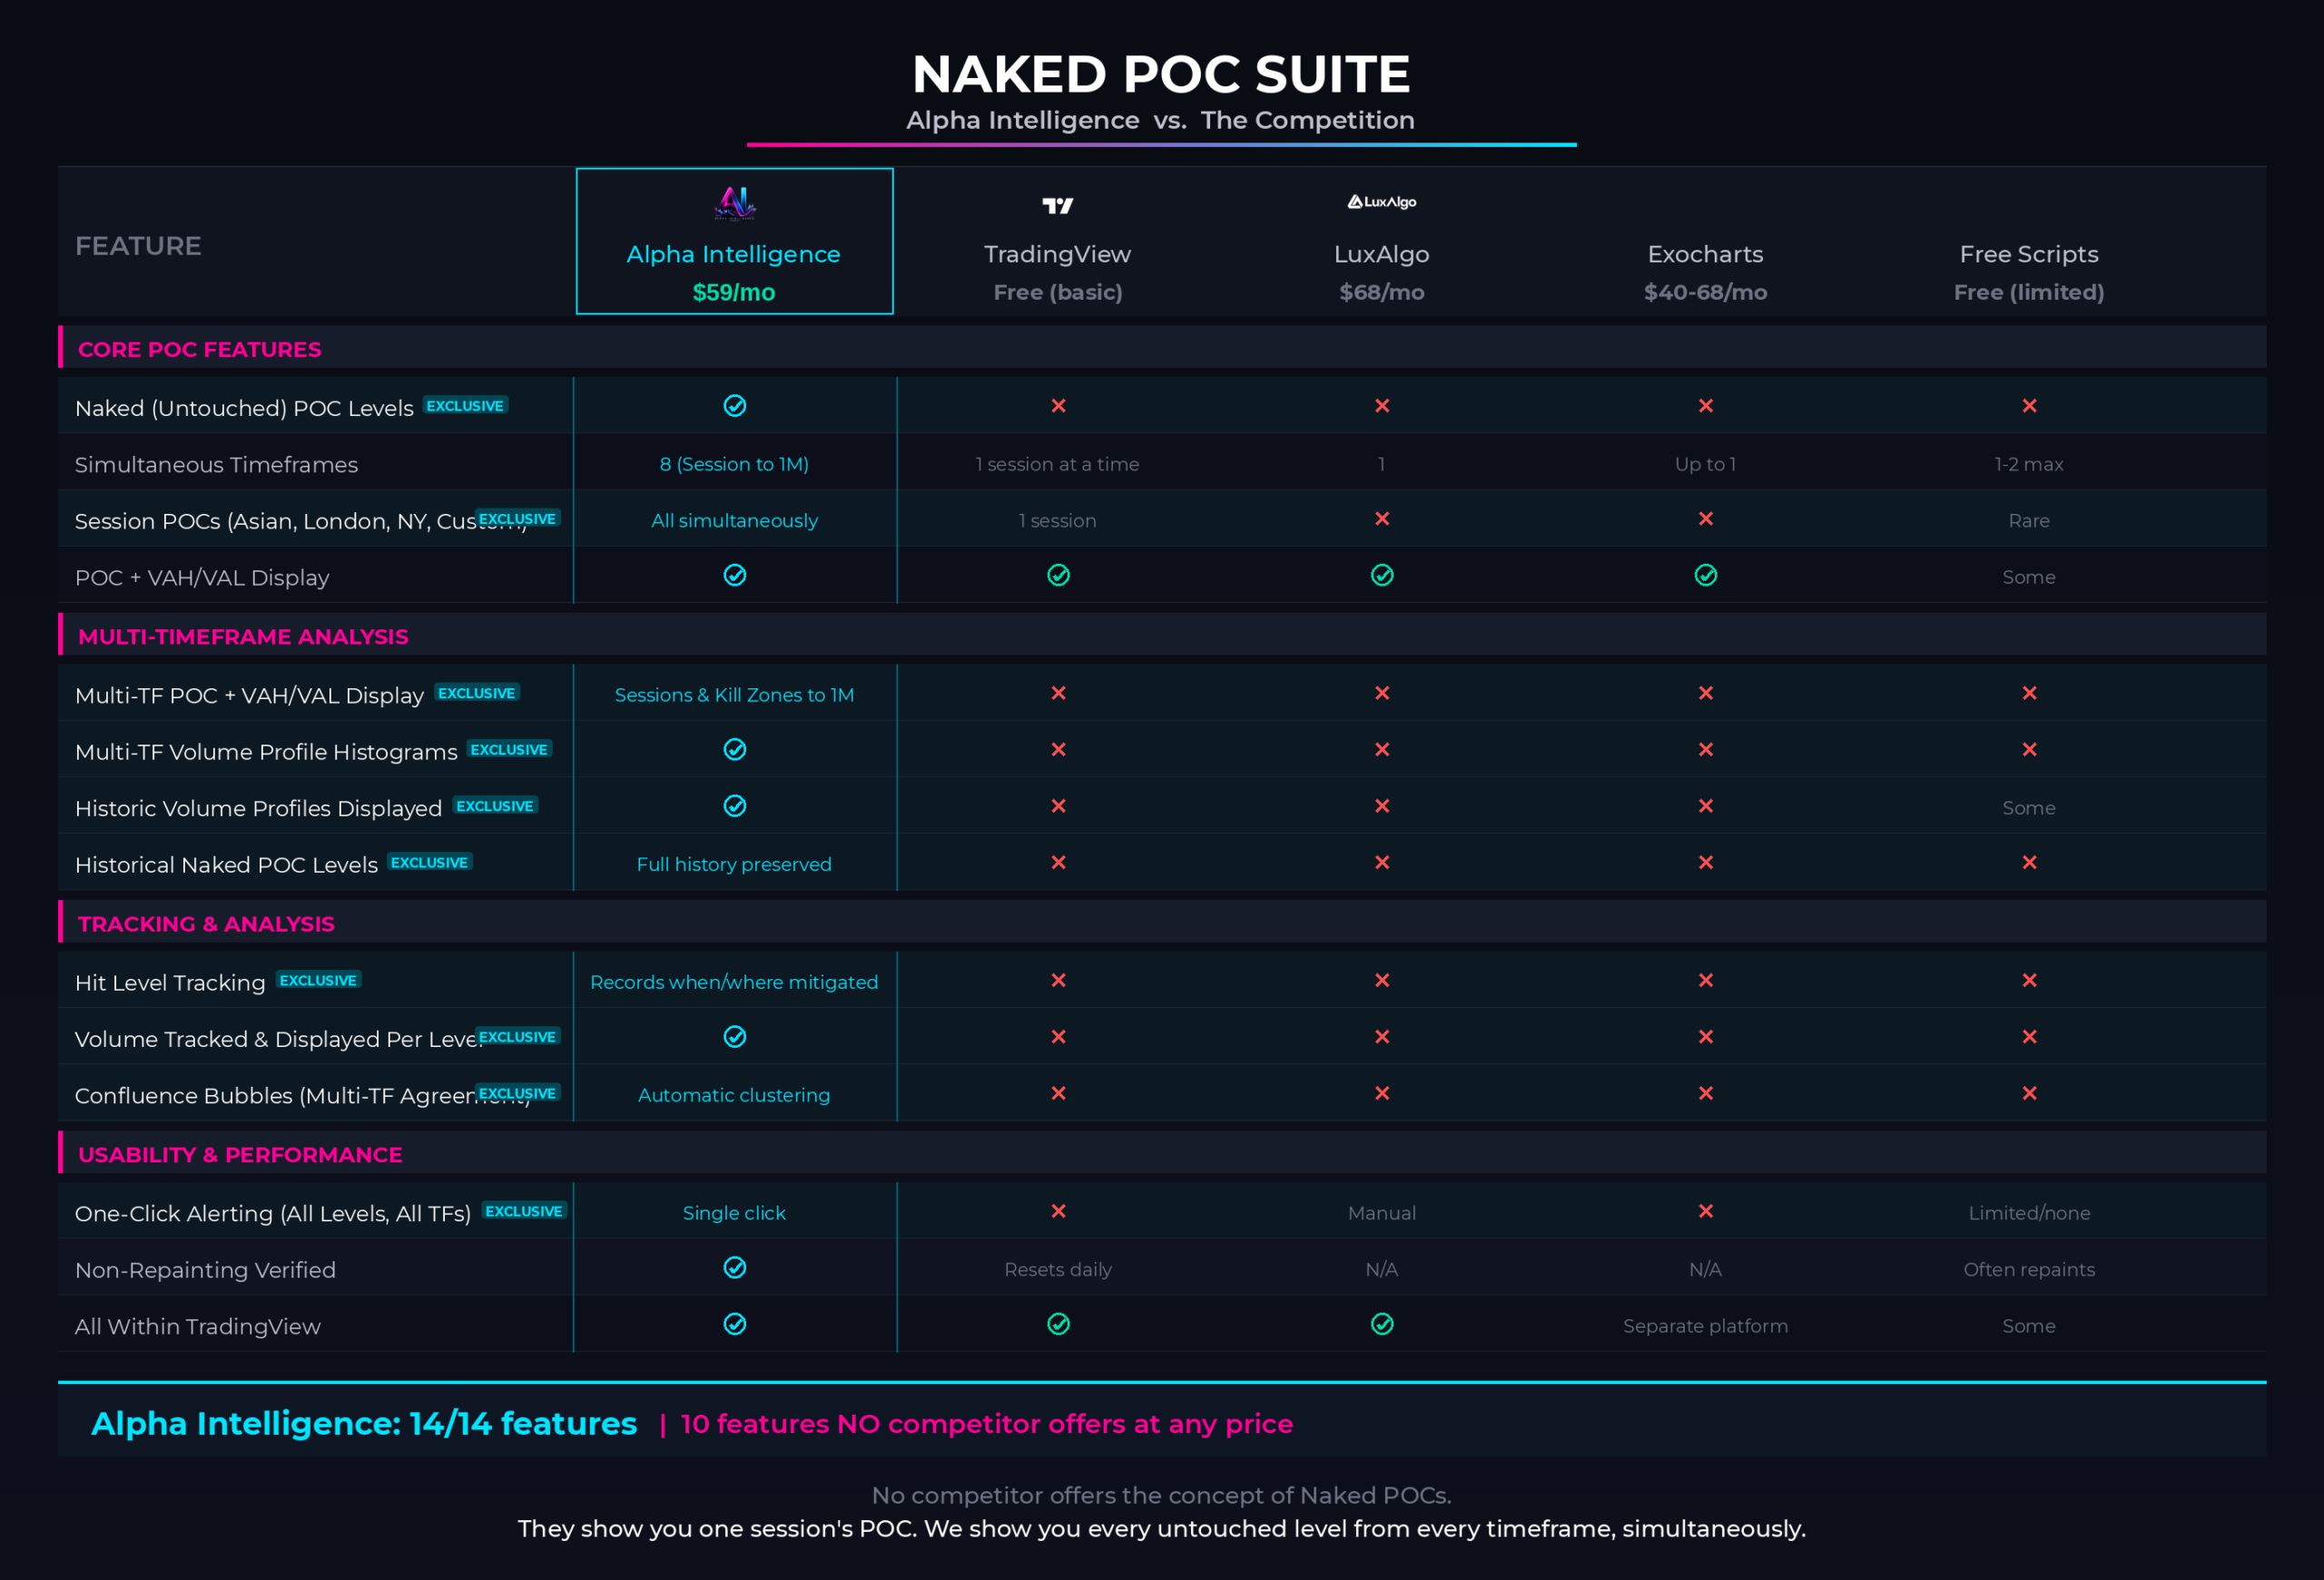
Naked POC Suite offers features that no other indicator on the market offers, and significantly outperforms anything available to date. Here is how…
*Click on the image below to zoom in.*
✕
There is not a SINGLE indicator in the market that actually offers the “Naked Institutional POC Levels” OR “Multi-TF Volume Profile Displays”. Ever wondered… WHY?
✕
LuxAlgo’s Volume Profile & POC Indicators don’t have multi-timeframe detection OR automatic NAKED LEVEL plotting.
✕TradingView’s Built-In Volume Profile & POC Indicators don’t allow you to see levels on up to 6+ timeframes at a time.
✕ExoCharts’s Volume Profile & POC Indicators don’t detect naked levels AT ALL.
✕TradingView’s Free Library of Volume Profile & POC Indicators are like a golf cart compared to the Ferrari that is Alpha Intelligence.
✕Our suite has 10 features that no other indicator in the ENTIRE indicator’s market offers. There is NO COMPETITION.
The Alpha Intelligence Naked POC Suite
A Complete Institutional Toolkit. One Subscription.
FEATURES & SPECS
ABOUT "NAKED" POCs & VOLUME PROFILES
•The level with the most volume is the Point of Control — the price where institutional traders spent the most time.
•This is where institutional orders are clustered. This is where price is most likely to react.
•When price moves away from POC, it creates an imbalance. When price approaches POC from below, institutional sellers are waiting. POC is a magnet for price.
•Professional traders use POC as their primary reference level. They understand that POC is where institutional activity is concentrated.
•These naked POCs are some of the most reliable support and resistance levels in all of trading because they represent prices where massive volume transacted but the market never came back to settle the score.
•They know that when price approaches POC, a reaction is likely. They trade POC bounces as high-probability signals
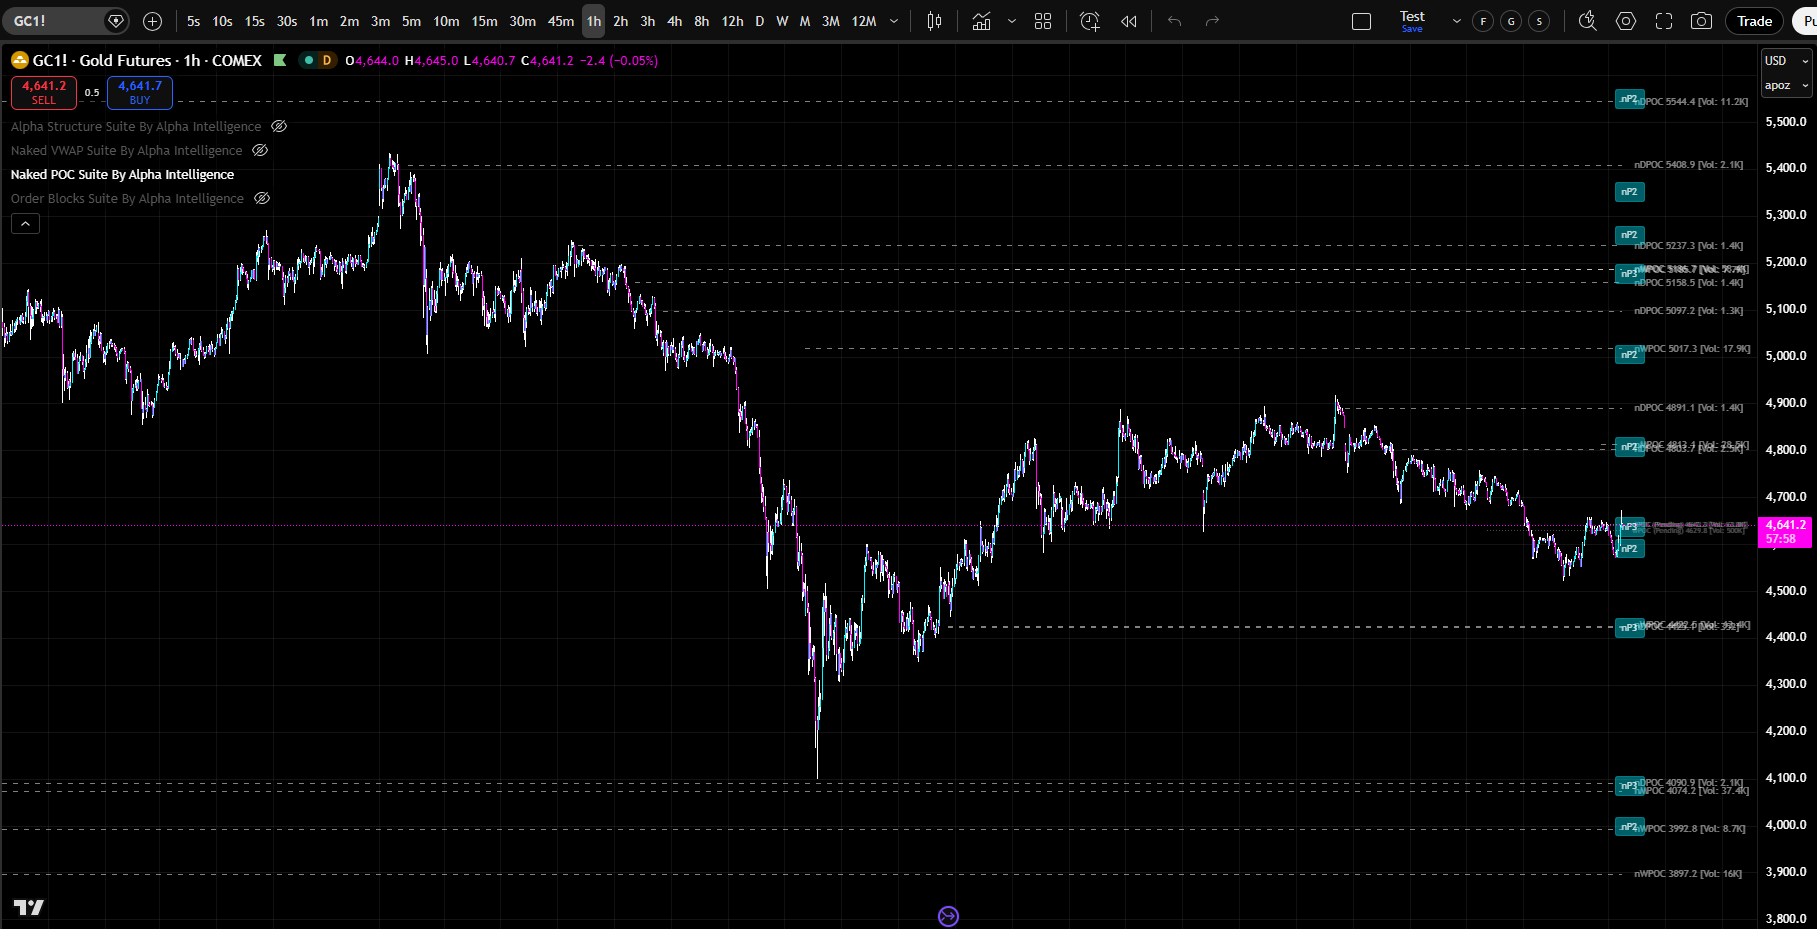
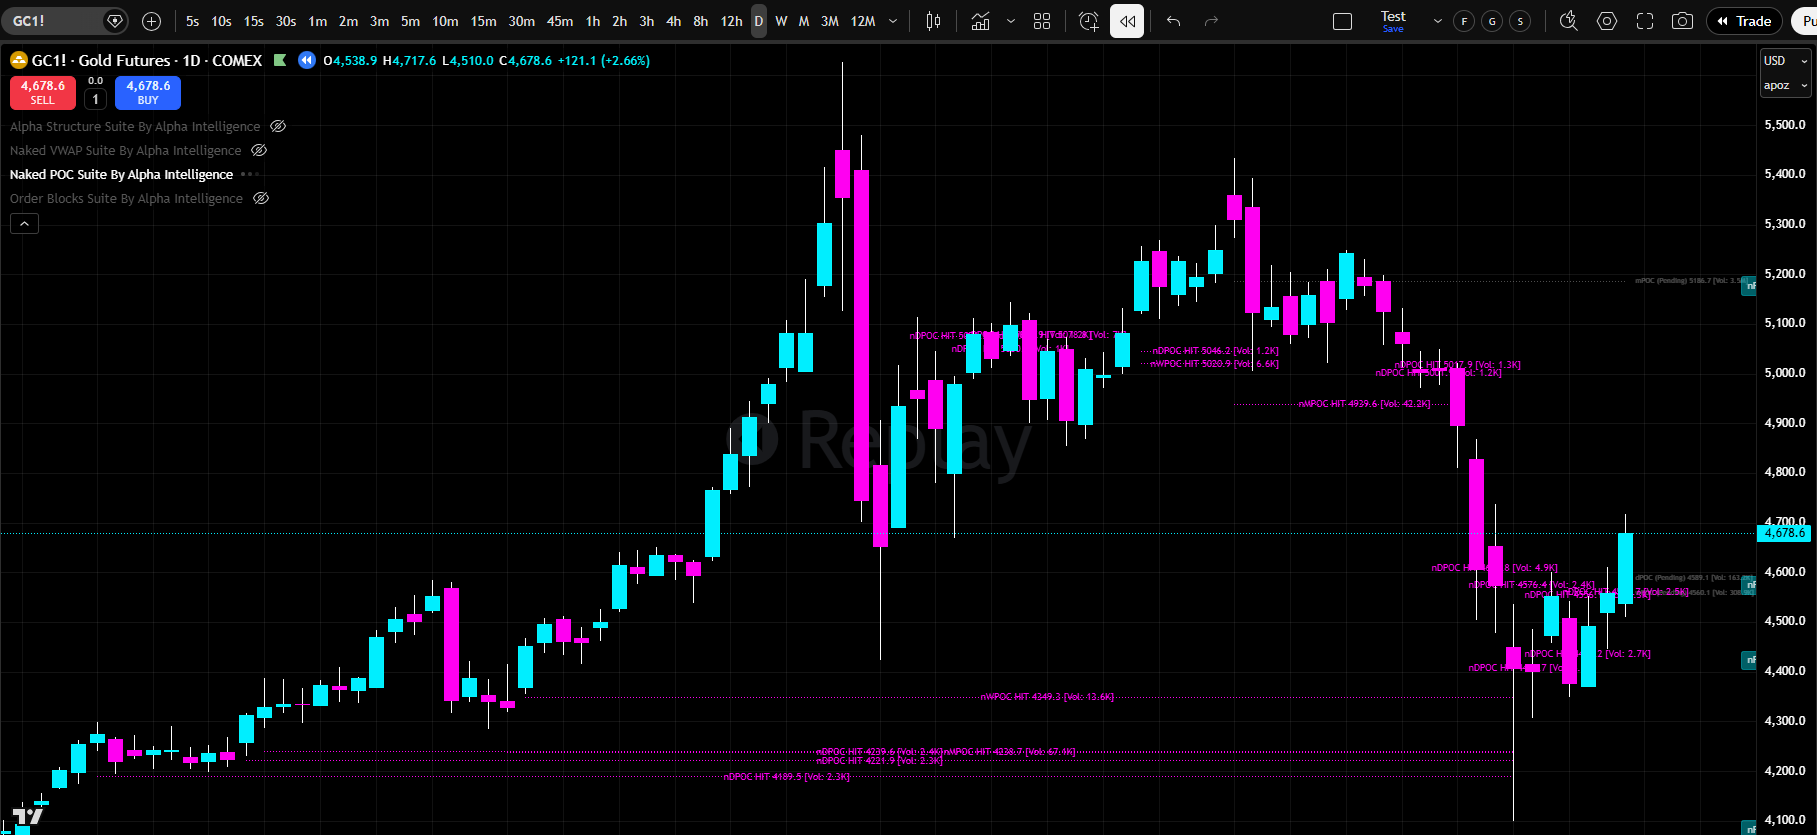
•The Naked POC Suite tracks these levels automatically across 8 independent timeframes, from Asia, London, NYC Sessions & Kill Zones, and from Daily all the way through Monthly. identifies where multiple naked POCs converge at the same price to form high-probability confluence zones, and alerts you in real time when price approaches or hits a key level.
•The Suite also identifies where multiple naked POCs converge at the same price to form high-probability confluence zones, and alerts you in real time when price approaches or hits a key level.
•If you were to plot every naked POC level manually, it would take you hours to do, on just a SINGLE chart / asset.- •
Our Suite does it in just SECONDS and can plot them FOR YOU on every chart you pull up in TradingView forevermore.
This is how institutions see the market, and where they do business — now you can too.
MULTI-TIMEFRAME POC CONFLUENCE
Know exactly where institutional traders are positioned – BEFORE price gets there.
•
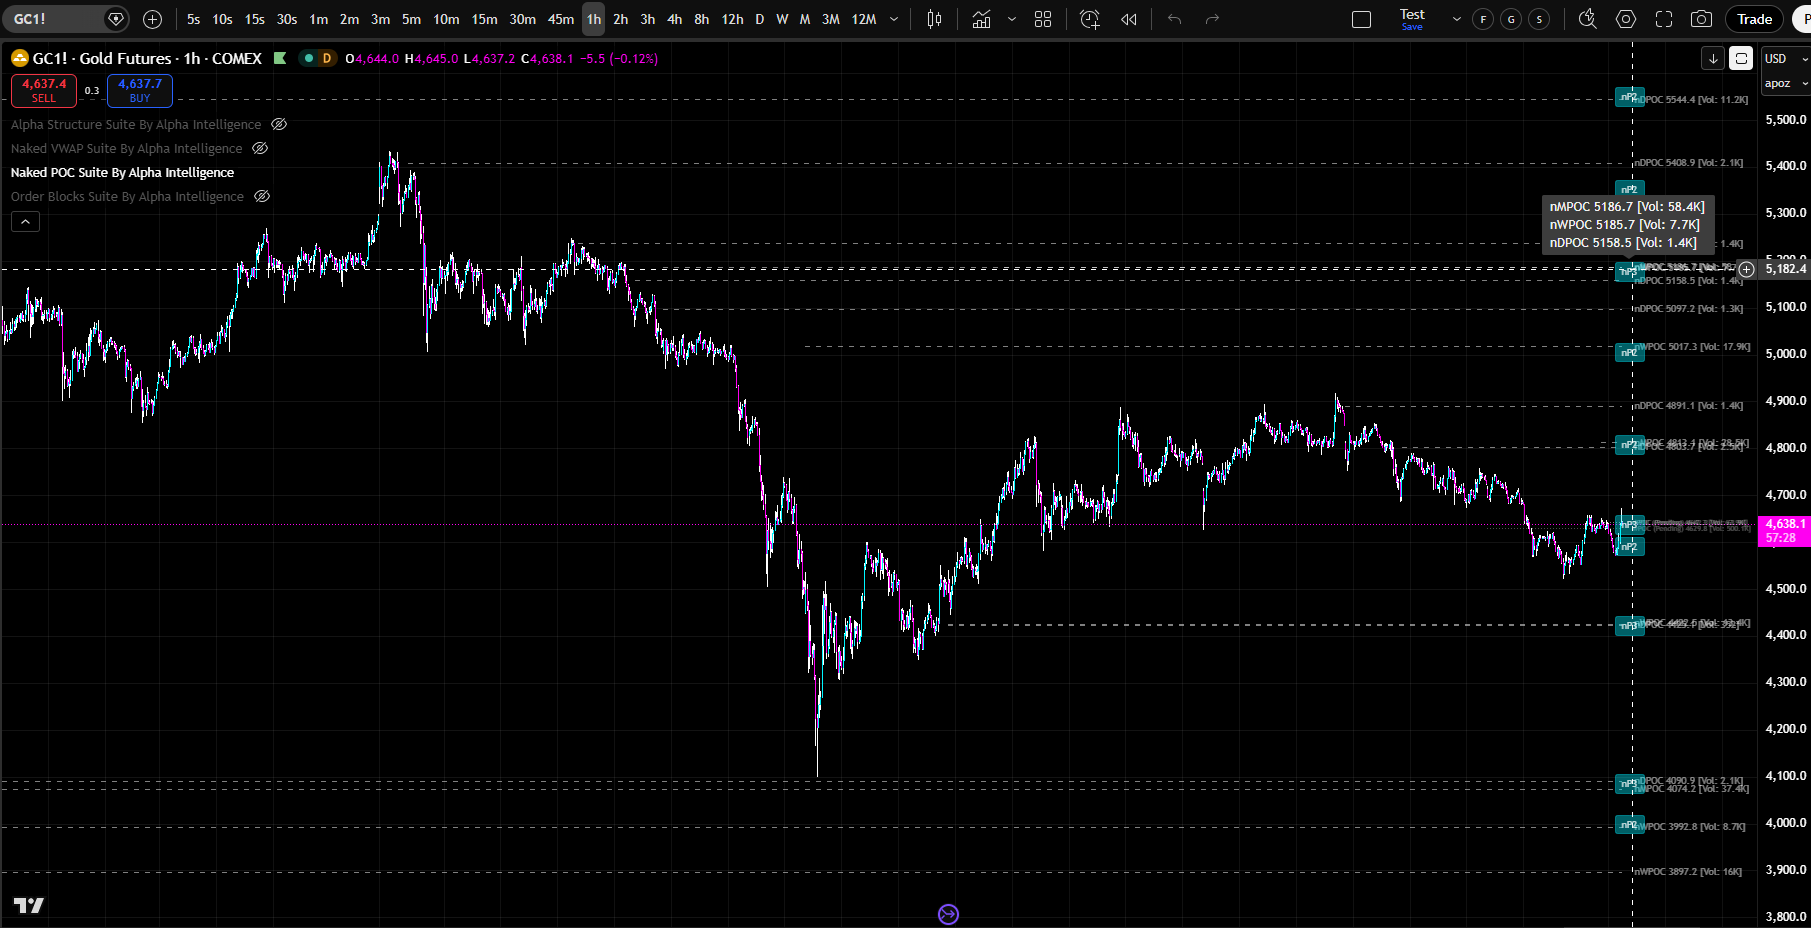
Naked POC Suite calculates POC simultaneously across eight period engines. When multiple sessions have POC levels at the same price zone, that is institutional confluence. That is where the strongest reactions occur.
•
Imagine seeing that the Daily POC, Weekly POC, and London Session POC are all clustered within a tight price zone. That is not just a trading level.
•
That is a high-probability support or resistance zone. That is where institutional traders across multiple sessions spent the most time. That is where price will react with force.
•
This is what Naked POC Suite shows you. This is what separates professional traders from retail traders.
•
Naked POC Suite identifies zones where multiple POC levels from different sessions cluster together.
•
These are the highest-probability trading zones.
•
When price approaches a POC cluster, prepare for a strong reaction.
•
When price breaks through a POC cluster, a new trend is forming.
•
POC clusters are where institutional traders are most active. They are where the most volume has traded across multiple sessions. They are where price is most likely to reverse or accelerate.
WHAT IS INCLUDED IN NAKED POC SUITE?
-
-
POC Clustering
•
Naked POC Suite identifies zones where multiple POC levels from different sessions cluster together. These are the highest-probability trading zones. When price approaches a POC cluster, prepare for a strong reaction. When price breaks through a POC cluster, a new trend is forming.
•
POC clusters are where institutional traders are most active. They are where the most volume has traded across multiple sessions. They are where price is most likely to reverse or accelerate.
8 Independent Period Engines
•
Daily, Weekly, Monthly
•
Asia Session, London Session, New York Session
•
London Kill Zone, NY Kill Zone
•
Each engine computes its own Volume Profile and tracks its own naked levels independently
•
Session times fully customizable (defaults: Asia 8PM–2AM ET, London 2AM–8AM ET, NY 8AM–5PM ET, London KZ 2AM–5AM ET, NY KZ 8:30AM–11AM ET) – Pick whatever sessions you want to see, and hide the ones you don’t
-
WHAT DOES NAKED POC SUITE AUTOMATICALLY PLOT ON YOUR CHART?
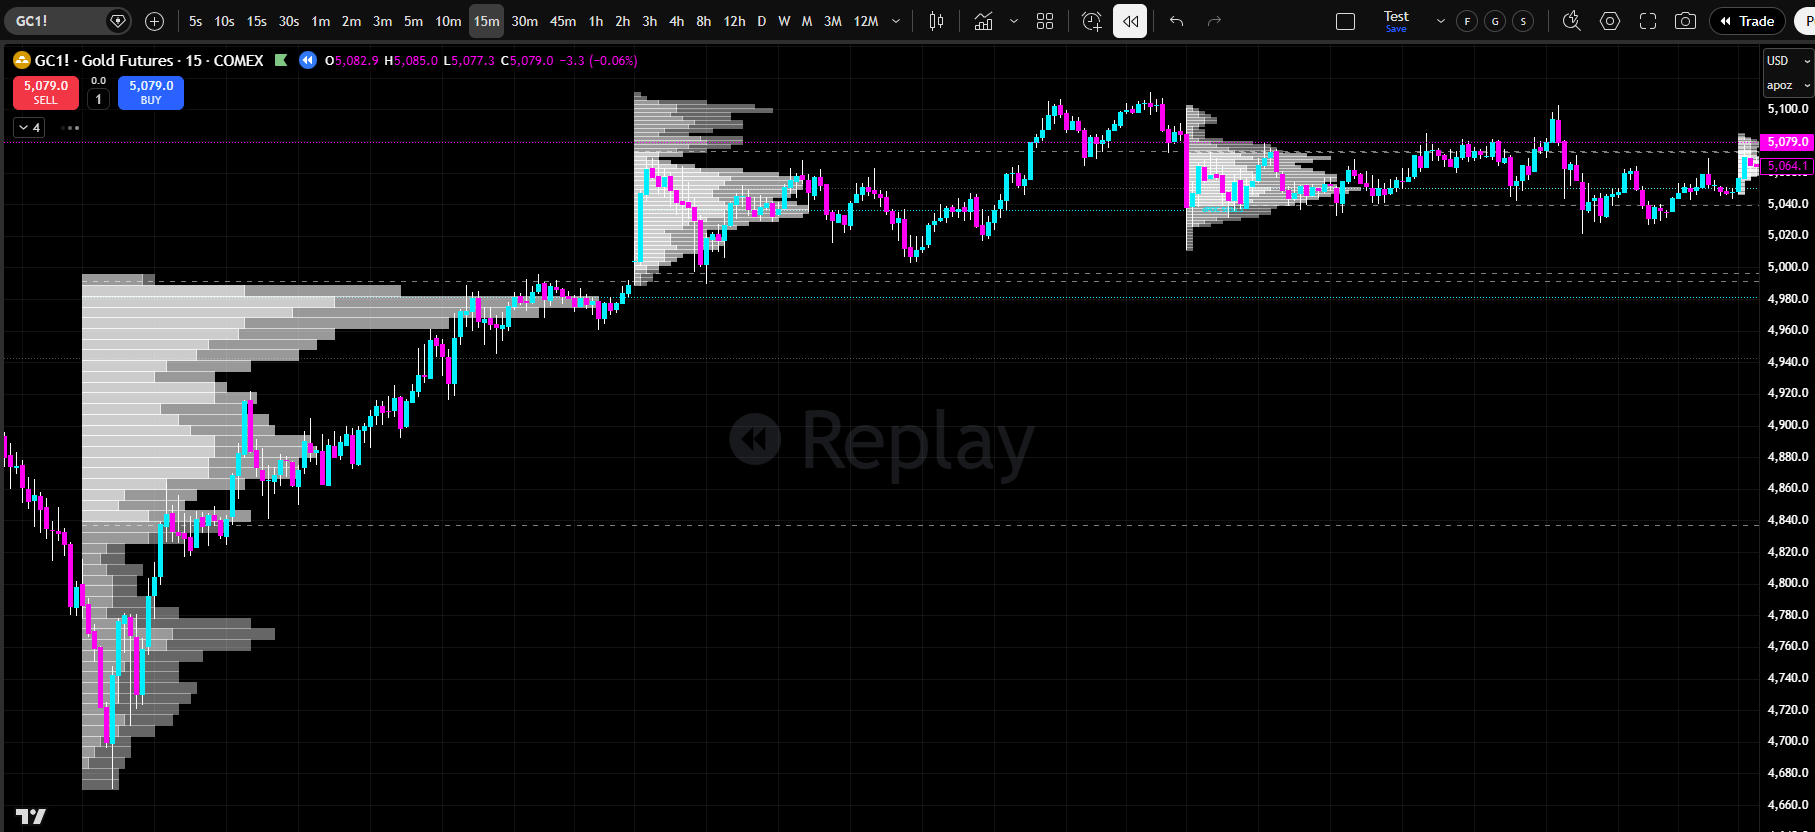
Full Volume Profile Histograms
•
Per-period VP histograms with split up/down volume coloring
•
Value Area distinction (inside VA vs. outside VA — 4 color inputs)
•
Configurable row size (240 default for high resolution)
•
Adjustable width and left/right placement
•
POC, VAH, and VAL lines within each histogram
•
VA Background shading available
•
Extend POC, VAH, and VAL lines to the right to project into current price action
Naked POC Tracking
•
Automatically identifies POCs from completed sessions that price has not returned to
•
Tracks and plots naked POCs across all 8 period types simultaneously
•
Volume displayed on every level’s label so you KNOW which levels matter the most
•
Pending POC, VAH, and VAL
•
See the developing session’s POC, VAH, and VAL updating in real time
•
Know where “fair value” is forming before the session closes
•
Pending levels included in confluence calculations
•
Independent toggles for Pending POC, Pending VAH, and Pending VAL
Hit Level Tracking
•
Records when and where each naked POC was mitigated
•
Hit levels displayed in pink with a line spanning from creation to mitigation point
•
Volume preserved on hit labels
•
Per-timeframe hit level toggles
•
OFF by default for a cleaner chart — enable for analysis and back-testing
Confluence Cluster Detection
•
Automatically identifies zones where multiple naked POCs from different periods converge
•
Displayed as bubbles with count (e.g., “nP3” = 3 levels clustered)
•
Hover over any bubble to see a tooltip listing each level’s period type, price, and volume
•
Pending POCs included in calculations
•
Configurable cluster tolerance (1.0% default), max bubbles, and minimum levels
FULL CUSTOMIZATION & CONTROL
13 Alert Types
•
nPOC Hit (Any) — any naked POC mitigated
•
New nPOC Created — new level created at session close
•
Pending Touch Tolerance — near-miss warning (within 0.1% of tolerance)
•
Price Approaching nPOC — early warning (within 0.5%)
•
nPOC Cluster Hit — price enters a confluence zone
•
8 per-period hit alerts: nDPOC, nWPOC, nMPOC, nAsiaPOC, nLdnPOC, nNYPOC, nLdnKZPOC, nNYKZPOC
•
Both “Any Alert” and specific named conditions available
•
Customizable alert prefix
•
Turn on the alerts you want, turn off the ones you don’t
•
Alerts automatically attach to every applicable level, saving you hours of “manual alert setting”
Tolerance & Mitigation
•
4 tolerance models: Strict, Percent (0.1% default), Tick (5 ticks default), Hybrid
•
Each model controls how close price must come to register as a hit
Dual-Gate Toggle System
•
Quick toggles in the Naked POCs section for fast on/off per period type
•
Per-session toggles for fine-grained control
Styling & Customization
•
Naked level line style: Solid, Dashed, or Dotted
•
Naked level line color, opacity, and width
•
Independent label color, opacity, and size
•
Label position: Left, Center, or Right (X) and Above, On Line, or Below (Y)
•
Label offset for multi-indicator compatibility
•
Global pending level styling (color, opacity, style, width)
•
Global hit level styling (pink default, independent controls)
Performance & Optimization
•
Visible price range filtering prevents chart zoom-out
•
Configurable max naked levels and max hit levels
•
VP History Count controls how many completed histograms are kept per period (5 default)
Multi-Indicator Compatibility
•
Label and bubble offset inputs prevent overlap with other Alpha Intelligence indicators
Naked POC Suite By Alpha Intelligence
Find Where Institutional Traders Spent the Most Time.
Trade Where Price Wants to Return.
Naked POC Suite is the most sophisticated point of control system ever built for TradingView.
✕
✕It calculates POC across up to ten simultaneous timeframes.
✕It identifies POC confluence zones where multiple timeframes agree.
✕It detects POC breaks and reversals, then shows you exactly where institutional traders spent the most time at every level of the market.
Standard POC analysis is incomplete.
It shows you one level.
It doesn’t show you confluence.
It doesn’t show you multi-timeframe structure.
It doesn’t show you where institutional traders are most active.
Naked POC Suite changes everything.
IT DOES THE WORK FOR YOU
You Don’t Have to Know Why It Works.
Just Watch It Work.
Professional traders use POC as their primary reference level.
Naked POC Suite gives you institutional-grade multi-timeframe POC & Volume Profile analysis that shows you exactly where institutional traders are positioned at every timeframe.
Don’t Understand Volume Profiles or POCs? It Doesn’t Matter!
You don’t have to know any of that.
The indicator already knows.
It plots every level for you, automatically, in real time, across every timeframe that matters.
Just turn it on. Watch what happens when price reaches the levels it plots.
Use the historical levels function and scroll back through any chart — you will see it for yourself.
These levels work. Visibly. Repeatedly. Undeniably.
GET STARTED TODAY
One Plan. Everything Included. Any Market.
$59 / month
Less than one bad trade.
Less than LuxAlgo’s single-tier plan.
Less than the cost of one month of “figuring it out yourself.”
No contracts. No hidden fees. Almost INSTANT TradingView access. Any chart. Any market. Cancel anytime. But You Won’t…